Partners


Countries at all income levels have the opportunity to build lasting economic growth and at the same time reduce the immense risk of climate change. But action is needed now.
The Global Commission, advised by some of the world’s leading economists, sets out a ten point Global Action Plan for governments and businesses to secure better growth in a low-carbon economy.
We live in a moment of great opportunity, and great risk.
The opportunity is to harness the expanding capacities of human intelligence and technological progress to improve the lives of the majority of the world’s people. Over the last quarter of a century, economic growth, new technologies, and global patterns of production and trade have transformed our economies and societies. In developing countries, nearly 500 million people have risen out of poverty just in the last decade – the fastest pace of poverty reduction for which we have data. 1 But still 2.4 billion live on less than US$2 a day, and urbanisation, rising consumption and population growth have put immense pressure on natural resources.
The next 10–15 years could be an era of great progress and growth. 2 In this period we have the technological, financial and human resources to raise living standards across the world. Good policies that support investment and innovation can further reduce poverty and hunger, make fast-growing cities economically vibrant and socially inclusive, and restore and protect the world’s natural environments.
But such a positive future is not guaranteed. Indeed, from the perspective of many economic decision-makers today, the outlook is troubling. Since the financial crash of 2008 and the recession that followed it, many countries have been struggling to achieve sustained prosperity. Job creation and productivity growth are widely inadequate, and inequality is rising in many places. Many low-income countries no longer know if they will be able to replicate the successes of middle-income countries. 3 Extreme poverty, low employment levels, and poor health and education outcomes are persistent problems.
Many emerging economies also fear getting stuck in an outdated model of economic development. It is striking that of over 100 countries labelled “middle-income” half a century ago, only 13 have since achieved high-income status. 4 Many have found it difficult to pursue sufficient investment in public services to meet the expectations of their rapidly expanding middle classes. Air pollution has also emerged as a major economic and social cost, with outdoor pollution alone linked to nearly 4 million premature deaths per year. 5
Meanwhile, most high-income countries are struggling with weak, unevenly distributed economic growth. Fragile public finances and continuing high levels of public and private debt are compounded by anxieties over competitiveness, inadequate investment in infrastructure renewal, and the pressure of ageing populations. 6
Then there are the unprecedented risks posed by climate change. The strong growth of the global economy before the financial crisis was accompanied by a marked surge in greenhouse gas (GHG) emissions. 7 Most of this came from the growing use of fossil fuels, along with other sources including agriculture, deforestation and industry. If current emission trends continue unchecked, the resultant increase in average global temperature could exceed 4°C above pre-industrial levels by the end of the century. This would be more than double the 2°C rise that world leaders have set as a limit to avoid the most dangerous climate impacts. 8
The risks associated with such warming are very large. They range from an increase in the frequency of extreme weather events such as floods and droughts, to severe pressures on water resources, reductions in agricultural yields in key food-producing regions, and losses of ecosystems and species. Changes in seasonal weather and precipitation patterns are already being observed, which can greatly affect rural livelihoods. Some additional warming is unavoidable due to the greenhouse gases already in the atmosphere. 9 Climate risks increase disproportionately as temperatures rise, becoming particularly high above 3°C of warming, as irreversible “tipping points” may be reached such as the collapse of ice sheets and resulting sea-level rise. 10
It is very difficult to estimate the economic costs of such effects, as there are many uncertainties. But the Intergovernmental Panel on Climate Change (IPCC) suggests that the likely costs of just 2°C of global warming would be of the order of 0.5–2% of global GDP by the middle of the century, even if strong adaptation measures are taken. Once warming has proceeded beyond this, the costs will rise further – though the IPCC finds there is too much uncertainty to estimate reliably by how much. 11 What the IPCC does confirm is that climate change impacts will affect the world’s poorest people the most; they are already doing so. But countries at all income levels face serious climate risks, as recent studies of the United States (among others) have shown. 12
Effective adaptation will be crucial to tackle the effects of warming already built into the climatic system, but it is not enough. Without stronger mitigation efforts in the next 15 years, which lead global emissions to peak and then begin to decline, the risk of exceeding 2°C of warming will greatly increase. 13 Delay in managing climate risk only worsens the problem. It increases the concentration of greenhouse gases in the atmosphere and their warming effect. And it makes it harder and costlier to shift course later on, 14 as the stock of high-carbon assets – and the number of people whose wealth and livelihoods depend on them – keeps growing, and low-carbon research and development (R&D) continues to lag.
The time to tackle climate risk is therefore now. Yet climate change is rarely the top priority for those whose decisions most affect it. Most policy-makers and business leaders face more immediate issues and risks. Many have understandable concerns about actions or investments which, whatever their long-term benefits, could involve short-term costs or loss of competitiveness. And they face particular barriers to addressing a problem, such as climate change, that requires international cooperation. This is particularly true for those in developing countries, which have not been historically responsible for causing climate change, and which still face huge challenges in reducing poverty and raising living standards. They want to be sure that wealthier countries will do their fair share, and will provide adequate finance to support poor countries’ efforts.
The challenges for economic decision-makers are thus profound. Can they overcome current economic problems and establish new models of growth? Can they, simultaneously, act to reduce climate risks?
The evidence presented in this report shows the answer to both questions is “yes”. The structural and technological changes unfolding in the global economy, combined with multiple opportunities to improve economic efficiency, now make it possible to achieve both better growth and better climate outcomes. The purpose of this report is to help economic decision-makers, in both the public and private sectors, make the most of this opportunity – and do so now.
There is a perception that strong economic growth and climate action are not, in fact, compatible. Some people argue that action to tackle climate change will inevitably damage economic growth, so societies have to choose: grow and accept rising climate risk, or reduce climate risk but accept economic stagnation and continued under-development.
This view is based on a fundamental misunderstanding of the dynamics of today’s global economy. It is anchored in an implicit assumption that economies are unchanging and efficient, and future growth will largely be a linear continuation of past trends. Thus any shift towards a lower-carbon path would inevitably bring higher costs and slower growth.
But “business as usual” in this sense is an illusion. New pressures on resources, changing structures of global production and trade, demographic change and technological advances have already altered countries’ growth paths. They will make the future inescapably different from the past.
The reality is that under any circumstances the next 15 years will see major structural transformations in the global economy. As population growth and urbanisation continue, global output is likely to increase by half or more. 15 Rapid technological advances will continue to reshape production and consumption patterns. Total investment in the global economy is likely to be of the order of US$300–400 trillion. 16 Of this, around US$90 trillion is likely to be invested in infrastructure across the cities, land use and energy systems where emissions will be concentrated. The global scale and speed of this investment will be unprecedented: it will inevitably result not in incremental or marginal changes to the nature of economies, but in structural ones.
But what kind of structural changes occur depends on the path societies choose. There is not a single model of development or growth which must inevitably follow that of the past. These investments can reinforce the current high-carbon, resource-intensive economy, or they can lay the foundation for low-carbon growth. This would mean building more compact, connected, coordinated cities rather than continuing with unmanaged sprawl; restoring degraded land and making agriculture more productive rather than continuing deforestation; scaling up renewable energy sources rather than continued dependence on fossil fuels.
In this sense, the choice we face is not between “business as usual” and climate action, but between alternative pathways of growth: one that exacerbates climate risk, and another that reduces it. The evidence presented in this report suggests that the low-carbon growth path can lead to as much prosperity as the high-carbon one, especially when account is taken of its multiple other benefits: from greater energy security, to cleaner air and improved health.
This analysis rests on a considerable body of experience and research on the relationship between economic growth and development, and climate action. This includes academic literature as well as policy and business reports by the Organisation for Economic Co-operation and Development (OECD), United Nations agencies, multilateral development banks, the International Energy Agency (IEA) and many others. 17 The Commission’s work has drawn extensively from this body of applied economic learning, as well as from many interviews with economic decision-makers in governments, city and subnational authorities, and businesses, and with investors across the world.
A central insight of this report is that many of the policy and institutional reforms needed to revitalise growth and improve well-being over the next 15 years, can also help reduce climate risk. In most economies, there are a range of market, government and policy failures that can be corrected, as well as new technologies, business models and other options that countries at various stages of development can use to improve economic performance and climate outcomes together. These opportunities exist in the short (less than 5 years), medium (5–15 years) and long term (greater than 15 years), as the various chapters of this report show. They require good policy design and implementation across three main drivers of change:
The report’s analysis focuses on three key economic systems which will be the locations of much of the growth in the global economy over the coming decades, and which are also the sources of most global GHG emissions. They are:
The large investments to be made in the next 15 years in these three systems make this a critical time for defining countries’ economic trajectories. Many of these investments will involve capital assets that last three to four decades or longer. They will thus play a key role in shaping the performance of the global economy not just in the next 15 years, but for the next half-century. The carbon-intensity of those investments, meanwhile, will largely determine the scale of future climate risk.
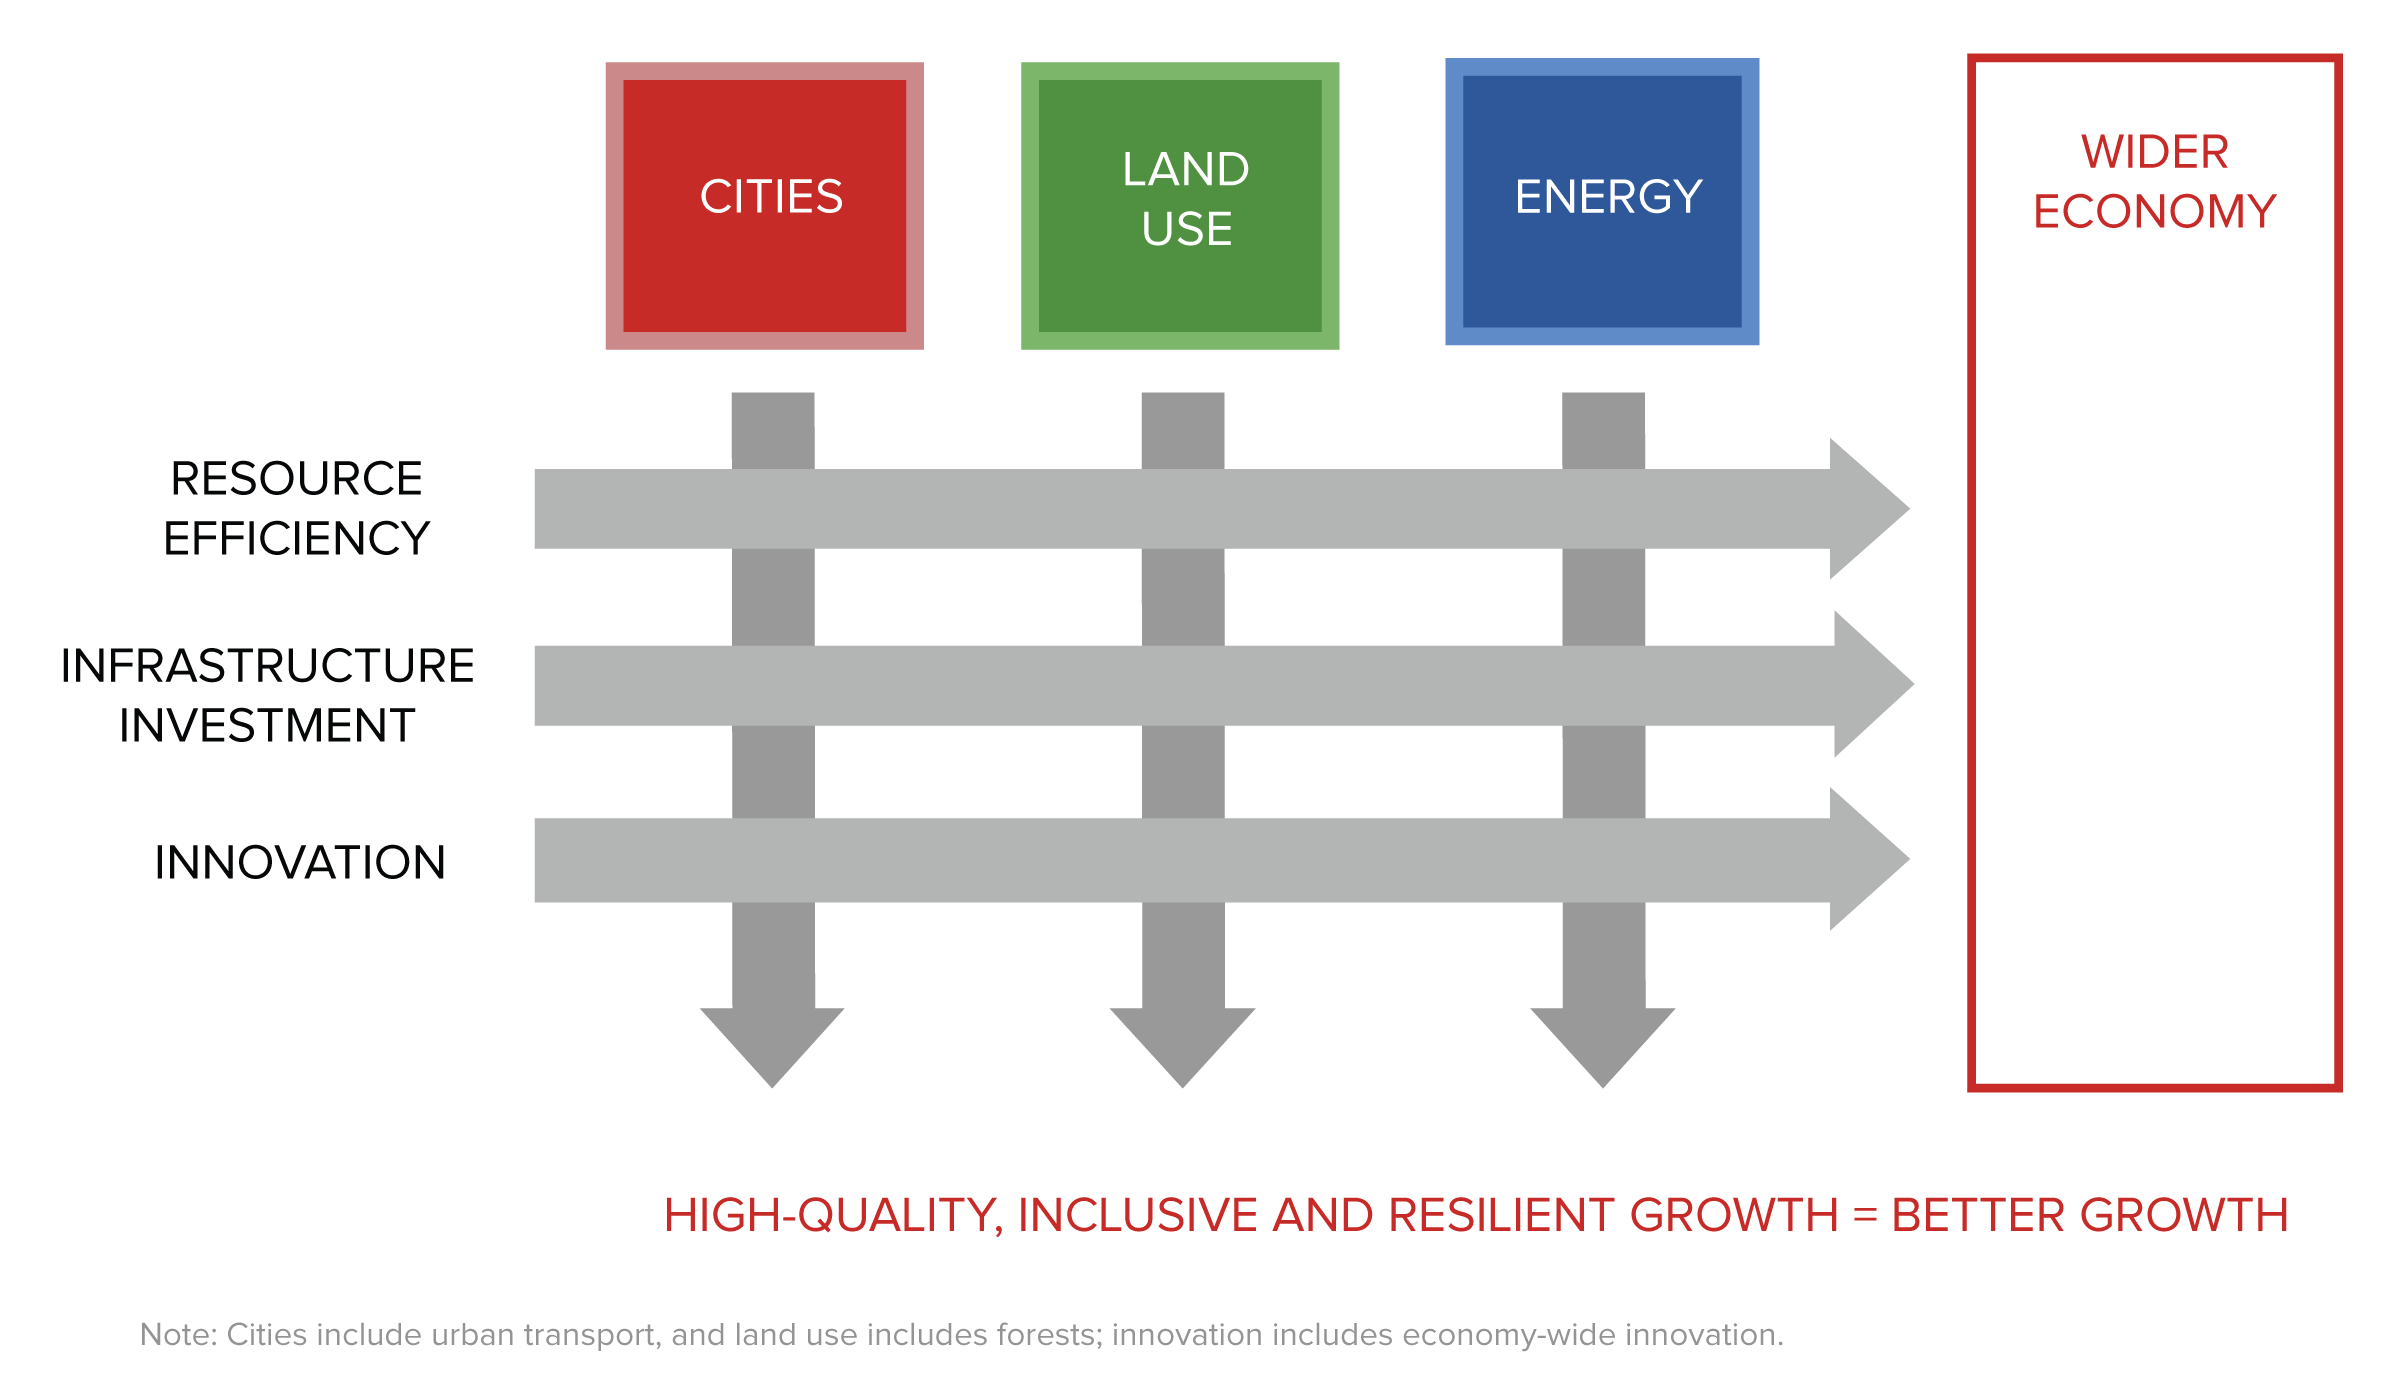
Note: Cities include urban transport, and land use includes forests; innovation includes economy-wide innovation.
The Commission’s work has focused on these three systems and on the drivers of change that are crucial to transforming them. But those drivers of change also have a broader role to play across the economy. For example, innovations in products and processes are already transforming the economic and emissions performance of energy-intensive process industries such as steel, aluminium, cement and chemicals, and will be central to future growth and emissions reduction. 31
Strengthening growth and tackling climate risk are therefore not just compatible goals; they can be made to reinforce each other. However, this will not happen automatically. It requires policy-makers to adopt an explicitly low-carbon pathway in economic policy. All three drivers need to be harnessed across all three economic systems. Above all, credible and consistent policy signals must be sent to businesses and investors.
This is essential: government-induced uncertainty is the enemy of investment, innovation and growth. The current vacillating and mixed signals on climate policy in many countries, especially in terms of a predictable carbon price, pose a significant dilemma for investors. In the long run, there is a significant risk that high-carbon investments may get stranded as climate policy is strengthened. But in the short run, many low-carbon investments are riskier and less profitable than they might be with strong climate policies. This uncertainty has raised the cost of capital and encouraged investors to hedge their bets between high- and low-carbon assets. Investment, jobs and growth all suffer as a result.
The conclusion that growth and climate goals can be mutually reinforcing is not surprising in the long run, beyond 15 years ahead. As the impacts of climate change grow larger, the potential harm to economies will increase. What this report shows, however, is that low-carbon policies can also generate strong growth in the medium term (5–15 years), provided that governments make the necessary policy and investment choices. Building more compact cities with good public transport, for example, not only reduces GHGs, but also allows people to move faster and more efficiently from home, to jobs, to shops and services; it reduces traffic congestion and air pollution, and it provides new business opportunities around transport hubs. Harnessing domestic renewable energy resources can boost energy security and reduce trade deficits. There is growing evidence that clean-tech R&D has particularly high spillover benefits, comparable to those from robotics, information technology (IT) and nanotechnologies.32
Even in the short term (the next five years), there are multiple opportunities to advance both economic and climate objectives by correcting market failures and policy distortions. No economy today is perfectly efficient, and many efforts to make key resources more affordable – such as by subsidising fossil fuels, water or fertilisers – have the unintended consequence of promoting inefficiency and waste. Policies to support established businesses may stifle competition from low-carbon innovators. Lack of coordination across levels of government and between neighbouring communities can lead to scattered development and sprawl, increasing the cost of infrastructure and public service delivery. Better policy design can correct these problems, increasing economic efficiency while lowering GHG emissions.
Of course, there are also many trade-offs. There are many immediate ways to achieve strong growth with higher emissions. Not all climate policies are “win-win”. The low-carbon transition will have winners and losers, and these costs will have to be faced and managed, as we discuss in more detail below. But short-term policies which weaken the prospects for stronger economic performance in the medium and long term also have real costs which should be properly acknowledged. Over time, growing climate change impacts will disrupt industry, farms and communities, with disproportionate harm to low-income countries and people, and require even greater government intervention. In such a context, it is unwise to be short-sighted.
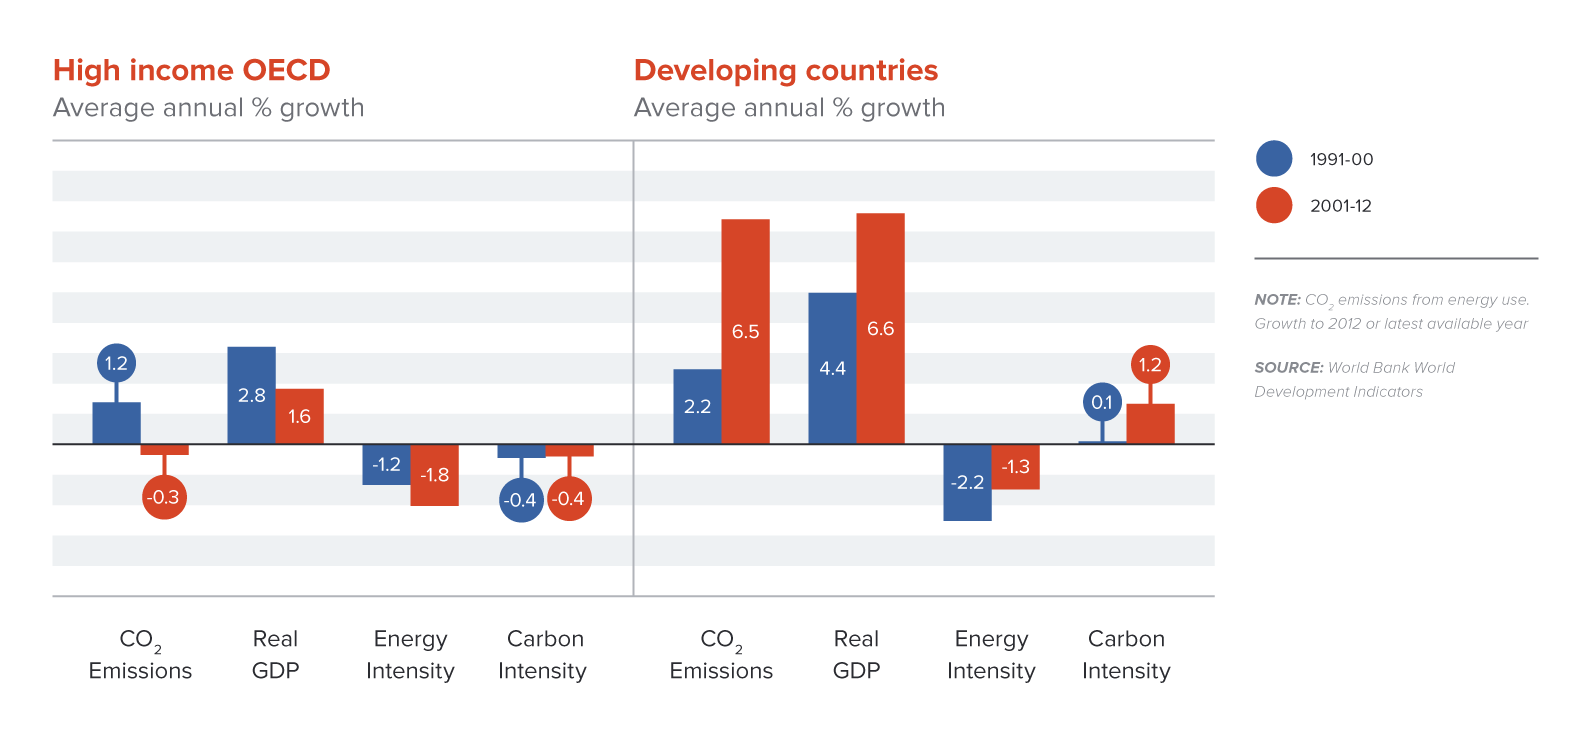
The evidence for these conclusions has been accumulating over the last decade. The theoretical basis for them has been known for some time. What is new is the practical experience around the world. National and local governments as well as businesses that have adopted lower-carbon strategies and policies have found them associated with economic performance as good as or better than their high-carbon peers’. 33 Much of this has been driven by recent technological advances. The decoupling of growth from carbon emissions in some of the best-performing economies, both in Northern Europe and in North America, demonstrates the gains that can be made in incomes, jobs, rates of innovation and profits from a low-carbon, resource-efficient model of growth. 34
Lower-carbon growth will look different in low-, middle- and high-income economies, and according to national circumstances. The Commission’s work has drawn on national studies in countries as diverse as Brazil, China, Ethiopia, India, the Republic of Korea and the United States. All exhibit multiple opportunities to achieve strong economic performance while reducing GHG emissions, but with very different policy, sectoral and investment mixes.
One question that arises from this analysis is whether lower-carbon forms of growth cost more than higher-carbon ones, in the sense of requiring greater capital expenditure. Analysis for the Commission shows that, in fact, the difference in infrastructure investment needs is likely to be relatively modest. As noted earlier, an estimated US$90 trillion will be invested in infrastructure in 2015–2030 (about US$6 trillion per year); a shift to low-carbon investments would add about US$4 trillion (about US$270 billion per year). 35 That would be less than a 5% increase in projected aggregate infrastructure investment requirements (see Figure 2).
The reason for this is that the higher capital costs of renewable energy and more energy-efficient buildings and transport systems would largely be offset by lower energy supply requirements due to energy efficiency savings, reduced fossil fuel investment, and the shift to better-planned, more compact cities. And there could be additional savings in operating costs once investments are in place – for example, from shifting to renewable energy sources and away from fossil fuels. These savings could potentially completely offset the additional capital investments. 36 Still, the costs will need to be financed, which for many developing countries will require international support. We discuss this further below.
Source: Climate Policy Institute and New Climate Economy analysis based on data from IEA, 2012, and OECD, 2006, 2012. 37
The transformational changes proposed in this report offer an opportunity not just to drive economic growth defined in terms of incomes and GDP, but to achieve multiple benefits, improving human well-being more widely. This underpins the Commission’s concept of “better growth”: growth that is inclusive (in the sense of distributing its rewards widely, particularly to the poorest); builds resilience; strengthens local communities and increases their economic freedom; improves the quality of life in a variety of ways, from local air quality to commuting times; and sustains the natural environment. All these benefits matter to people, but they are largely invisible in GDP, the most widely used measure of economic output.
In this sense the quality of growth matters as much as its rate. That means decision-makers need better tools to evaluate the impact of specific policies and actions, and to track economic performance more broadly. The Commission therefore supports the development and use of a wider set of economic indicators. If high rates of growth, for example, result in high levels of air pollution or environmental degradation, or if the rewards of growth are not widely distributed to reduce poverty and unemployment, it is legitimate to ask whether the economy is truly performing well. By the same token, if GDP growth is slower but other indicators show improvements, economic performance may be regarded as superior. These are judgements which people and governments will make in their own ways. 38
History suggests that societies tend to place more value on the quality of growth as they become wealthier: with their basic needs met, they can afford to address a broader set of concerns. The Commission’s analysis suggests that countries may want to place greater weight on the quality of growth earlier in their development journey, given the economic costs of air pollution, congestion, land degradation, deforestation, and other problems.
Many of the investments and policies discussed in this report will be particularly valuable to the poorest and most vulnerable people in developing countries: smallholder farmers whose crops are increasingly threatened by land degradation and climate change; the 350 million people who live in (and often depend on) forests; 39 the billions who lack modern cooking facilities, electricity or both; 40 and low-income urban residents who rely on public transport. The low-carbon economy can help reduce poverty and raise living standards in many ways, such as through “climate-smart” agriculture, payments for ecosystem services, off-grid renewable energy solutions, and bus rapid transit (BRT) systems, among many others.
The potential for a low-carbon transition to improve air quality in particular is significant. As noted earlier, rapid economic growth based on fossil fuels has led to severe air pollution in many middle-income countries. New analysis for the Commission values the health and mortality burden of air pollution in the 15 top GHG-emitting countries at an average of 4.4% of GDP (see Figure 3). In China this rises to more than 10% of GDP. 41 Substituting coal by natural gas and especially low-carbon energy sources such as renewables, hydropower and nuclear can therefore lead to major improvements in public health.
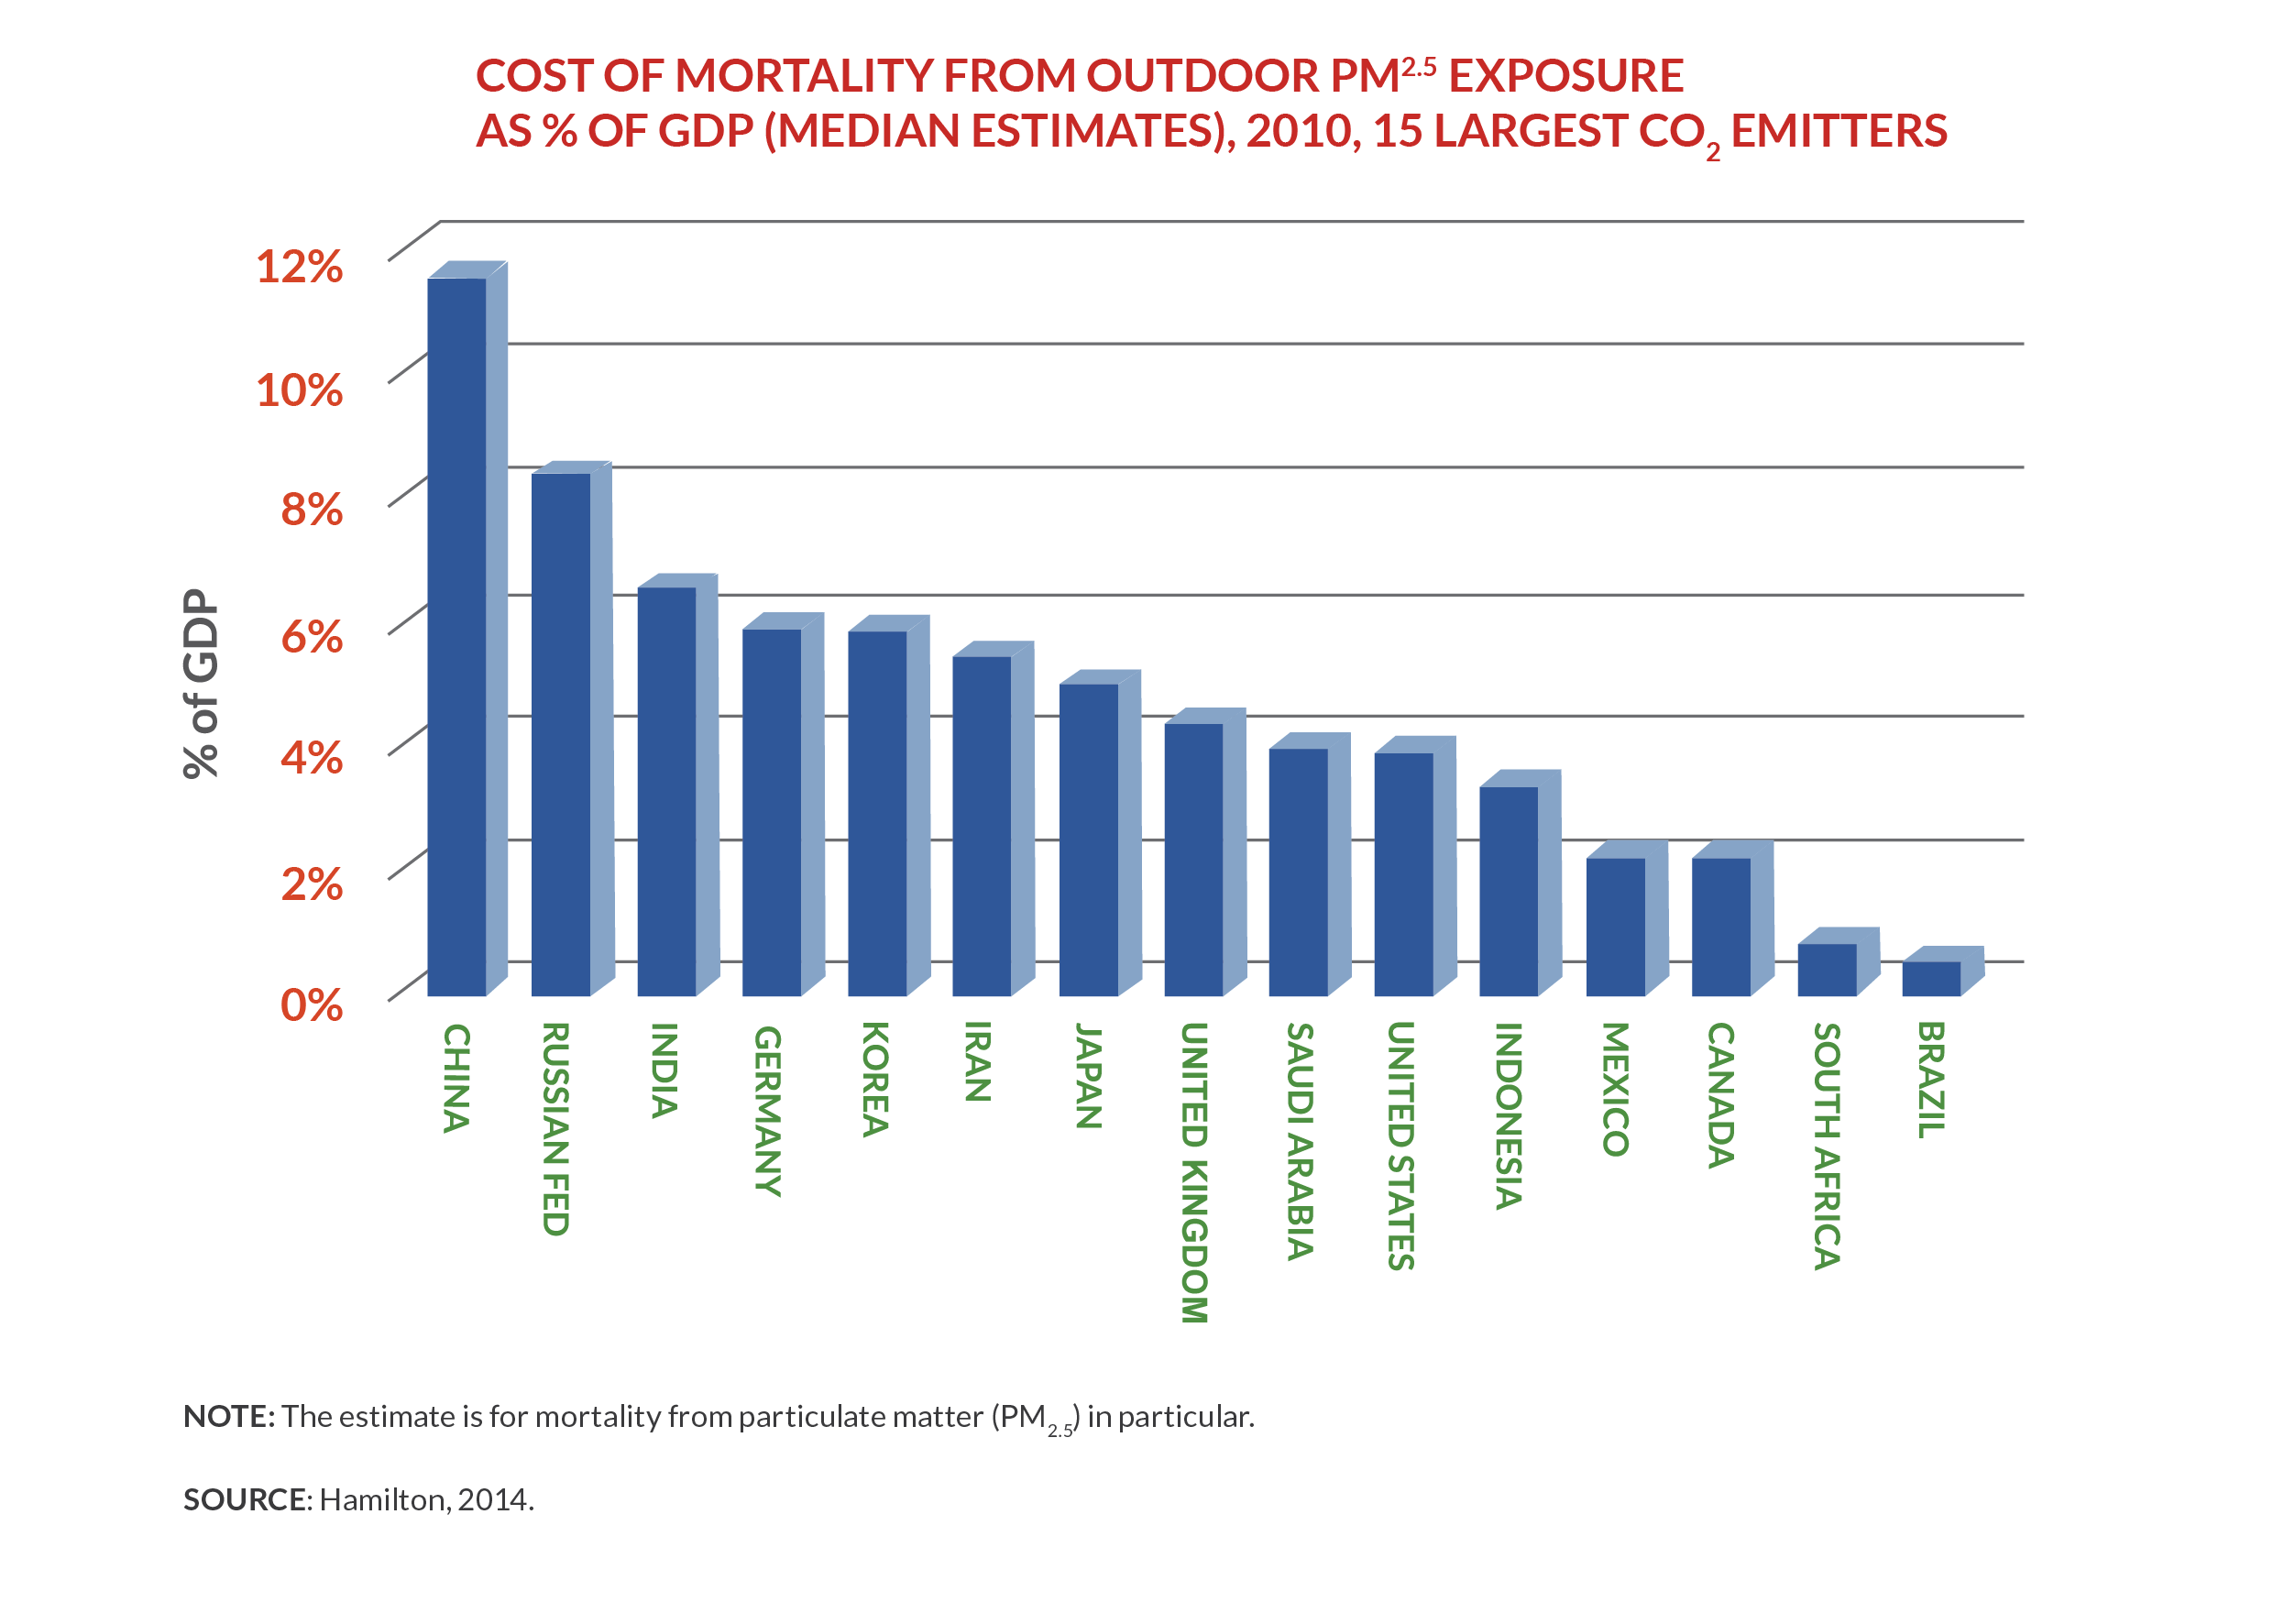
Note: The estimate is for mortality from particulate matter (PM2.5) exposure in particular, which was also the focus of recent World Health Organization mortality estimates. Source: Hamilton, 2014. 42
Of course air quality can also be improved by interventions which do not lower GHG emissions, such as “end-of-pipe” pollution controls and relocation of coal-fired power stations and heavy industry away from urban areas. Realising the twin benefits of lower carbon emissions and improved health requires deliberate policy choices. Research carried out for the Commission in China suggests that doing both together is often the most cost-effective option. 43 It is clear that air pollution increases the “real cost” of fossil fuel use. For example, in large parts of Southeast Asia, coal-fired power costs as little as US$60–70 per MWh, but even conservative accounting for air pollution in 2030 adds a cost of US$40/MWh, enough to bridge or exceed the cost gap to alternative power sources. 44
A related example is in urban transport. The Commission’s analysis of urban development planning shows cities that control sprawl and are built around efficient public transport systems can both stimulate economic performance (by reducing traffic congestion, making journeys shorter, and reducing fuel costs) and reduce GHG emissions. 45 But they are also likely to improve air quality, reduce road accidents (a major source of death and injury, particularly in developing countries 46), and generate higher quality of life for residents. This, in turn, can make them more attractive to businesses and their potential employees.
These examples illustrate the potential for a lower-carbon development path to generate multiple benefits. Indeed, for most city authorities and energy and environment ministries now pursuing air quality and urban development policies throughout the world, climate change is rarely the primary reason for taking action. The reduction in carbon emissions is in effect a co-benefit of policies designed to meet other economic and social goals.
Like development more generally, low-carbon growth can increase or reduce vulnerability to climate change, depending on the choices made. 47 A crucial first step is to “climate-proof” low-carbon investments – to ensure that new infrastructure, for example, is resilient to future climate change, and that it does not leave people more vulnerable to hazards. In some cases, simple precautions will suffice, such as avoiding construction in areas prone to flooding or landslides; at other times projects may prove unviable, such as a hydropower station on a river with diminishing flows. There are also potential measures with multiple benefits: increasing resilience, supporting growth and lowering emissions. For example, climate-smart agriculture practices such as minimising tillage and planting trees on and around farmland can boost crop yields, reduce the need for inputs, increase soil carbon storage, and reduce vulnerability to drought. 48 In general, there is a strong convergence between the goals of low-carbon development and environmental sustainability.
The processes of economic change discussed in this report contain four sets of variables that standard economic models do not handle well, either individually or in combination: the processes of structural transformation, the dynamics of technological change and innovation, the local and global economic impact of growing climate risk, and the valuation of non-market outputs (such as better air quality), including the trade-off with market outputs.
There is growing evidence to suggest that such models tend to overestimate the costs of climate action and underestimate the benefits. Yet even recognising this bias, the models suggest that growth and climate action can work together. In the short term, most economic models show that low-carbon pathways have higher initial rates of investment, which reduce current consumption, but have the potential to raise consumption in the medium- to long term. Some economic models that allow for efficient, fiscally neutral recycling of carbon revenues tend to show low-carbon policy (such as carbon pricing) only slightly reducing or actually increasing growth rates, even in the short run. 49
In the longer term, even so-called “general equilibrium” models (which rather unrealistically assume that economies operate at more or less perfect efficiency at all times, and struggle to integrate the dynamic increasing returns associated with disruptive technological change), predict that the difference between global GDP in low- and high-carbon scenarios by around 2030 is only around 1–4%. 50 Given how much the economy will have grown by then, that is not large: it is equivalent to reaching the same level of GDP 6–12 months later. 51 Those models which have attempted to incorporate the impacts of climate change itself show, perhaps unsurprisingly, that global GDP could perform better in lower-carbon scenarios than in higher-carbon ones, as the costs of climate impacts in the latter grow over time. 52
Economic modelling also suggests that low-carbon policies will create employment opportunities in some sectors, while in others, they will be lost (or not created). But most models suggest that the overall effects, even of strong low-carbon policies, are small, generally around plus or minus 1–2% of total employment. They depend partly on the kinds of policies adopted: some analyses suggest that using carbon pricing revenues to cut other, distortionary taxes can lead to net growth in employment in some cases. Other models show small net losses. In both cases the impact of low-carbon policy is dwarfed by the much larger effects of macroeconomic and labour market policies, and changes in the structure of economies. 53
But the fact that in relation to the economy as a whole, the net employment impacts of low-carbon policies are small does not mean that they are unimportant. On the contrary, in some sectors, the impact on jobs is likely to be significant. 54 Employment in the coal sector, which is still relatively labour-intensive in developing countries but already highly mechanised in developed economies, will almost certainly decline even beyond the job reductions that technological change would anyway cause. Employment in heavy and energy-intensive industrial sectors is also likely to be affected, as the shift to a low-carbon economy would probably shrink the relative share of these industries in the economy over the long term. At the same time, the relative value of companies involved in the fossil fuel sector in general (oil and gas as well as coal) is likely to decline over time, as future demand falls.
There is no doubt that this will create real challenges in countries where these sectors are important. Governments may need to support affected industrial sectors in developing new lower-carbon strategies, particularly to exploit the potential for technological innovation in products and processes. 55 Owners of fossil fuel assets (including governments and pension funds), and public authorities dependent on tax revenues and royalties from these sectors, will need to develop long-term transition strategies. These processes will be gradual, taking place over decades, but the earlier they are set in motion, the lower the costs will be.
There will also be many job gains. The evidence shows that investment in low-carbon energy sources and energy efficiency is a major source of job creation. For example, the International Renewable Energy Agency (IRENA) estimates that almost 6 million people were directly employed in the renewable energy sector in 2012, including over 1.7 million in China. 56 This is approaching the number of people employed in the coal industry. 57 As developed countries have adopted low-carbon measures, there has been a little-noticed but remarkable growth in employment in a wide range of businesses in the “low-carbon sector”. 58 As the transition to a lower-carbon economy accelerates, this pattern of job creation and business expansion is likely to be replicated more widely.
These relative shifts in employment between sectors will require active management by governments to ensure the political viability of a low-carbon transition. Explicit measures will be need to be implemented to support and compensate workers displaced as a consequence of the shift towards a lower-carbon economy, and communities affected by industrial decline. 59 These might include direct financial assistance, retraining and reskilling, and investment in community economic development. 60
Strategies of these kinds to achieve a “just transition”, tailored to different sectors in different countries, will need to be developed by governments at both the national and sub-national levels. More generally, it will be important for economic policies to encourage and support the redeployment of both labour and capital into new and growing sectors as others decline. Such policies, including those which stimulate open and competitive markets, are not only good for growth, but will also significantly reduce the costs of adjustment to a low-carbon economy.
“Just transition” strategies will also need to ensure that support is provided to low-income households affected by rising energy and resource prices. Higher prices are the likely consequence of two kinds of policies which the Commission argues will be essential for a low-carbon transition: the phase-out of fossil fuel subsidies, and the introduction of carbon pricing. The Commission fully recognises the political difficulties associated with such policies. It is particularly sensitive to the challenges faced by low-income countries, given their more limited institutional and financial resources, and the urgency of addressing extreme poverty.
However, the Commission is also encouraged by success stories in both developed and developing countries. Ghana and Indonesia, for example, have succeeded in reducing fossil fuel subsidies by using part of the revenues released to provide conditional cash transfers and other forms of financial assistance to low-income households. 61 A number of countries and states, such as Sweden and British Columbia in Canada, have used the revenues from carbon pricing policies or other sources of expenditure to compensate households and to subsidise energy efficiency measures, which can help cut overall energy bills. 62
Social protection policies of these kinds designed to manage the transition to a lower-carbon economy in a fair way are integral components of the policy toolkit which governments will need. Experience in almost all countries which have been through a process of economic restructuring shows that it is the distributional impacts on those sectors and communities adversely affected by change which make them politically tough to carry through. Every country will need to find its own context-specific strategies to manage these consequences.
The transition to a lower-carbon economy will be particularly difficult for low-income countries whose principal challenge remains the reduction of poverty. The Commission strongly believes that the developed world has an obligation to provide developing countries with additional financial, technical and capacity-building support to enable them to finance lower-carbon and more climate-resilient investment strategies.
Developing countries will especially need support in financing capital-intensive low-carbon and climate-resilient infrastructure assets. This reinforces the need for good, predictable regulatory arrangements which can attract private capital, alongside flows of long-term, concessional, international public climate finance. International climate finance flows need to increase sharply if climate risk is to be reduced and developing countries are to achieve lower-carbon and more climate-resilient development paths. The developed countries will need to set out a pathway to show how they will achieve their agreed goal of mobilising US$100 billion per year in public- and private-sector finance by 2020.
The analysis conducted for the Commission suggests that, in many of the most crucial fields of growth over the coming 10–15 years, there are significant actions and policies which can drive both strong economic performance and reductions in the trajectory of GHG emissions. But how far can emissions be reduced by these methods? Would this be enough to prevent what the international community has described as the risk of “dangerous” climate change? 63
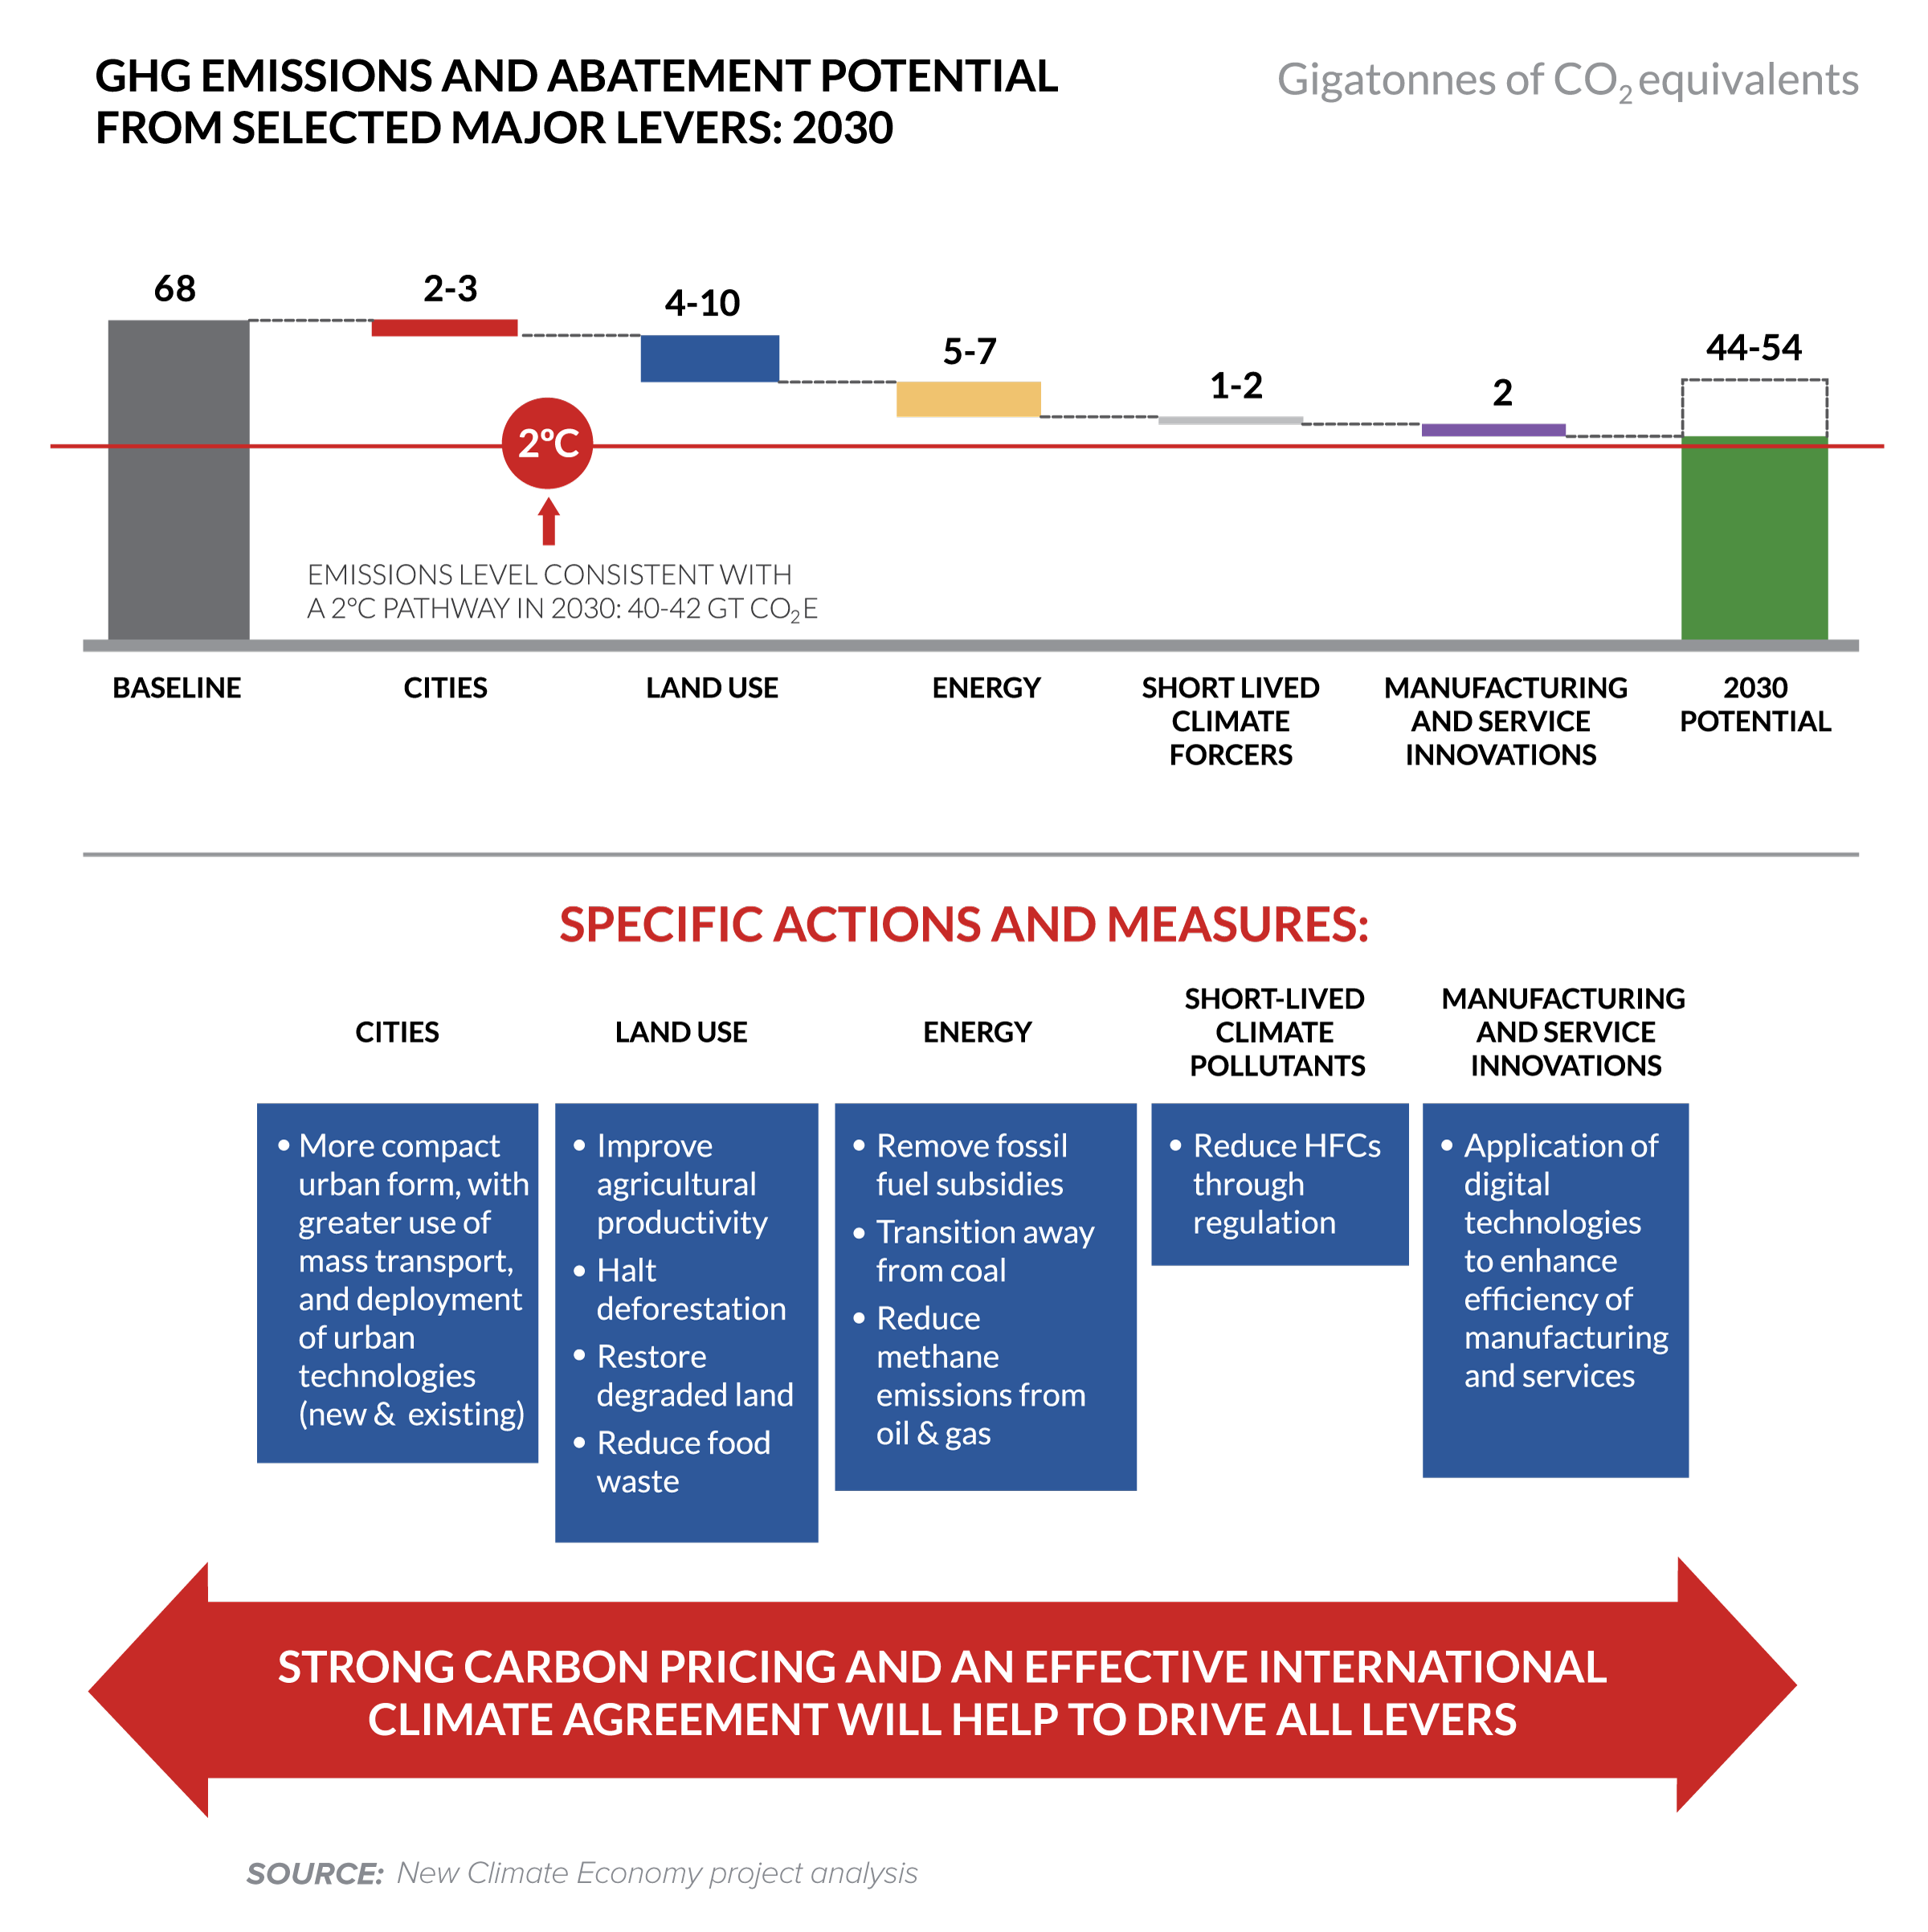
Answering this question requires, first, an idea of the trajectory of emissions which would be consistent with the international goal of holding the average global temperature rise to no more than 2°C above pre-industrial times. The Intergovernmental Panel on Climate Change (IPCC)’s review of recent emission projections suggests that if current trends continue, global emissions in 2030 will be around 68 Gt CO2e, compared with around 50 Gt CO2e today. 64 To have a likely (more than two-thirds) chance of holding the average global temperature rise to 2°C, the IPCC suggests that by 2030, global emissions should be no more than 42 Gt CO2e per year. That would require a reduction in emissions over the “base case” of 26 Gt CO2e by 2030.
To achieve this target, the carbon productivity of the world economy (defined in terms of US$ of world output/tonnes of GHG emissions) would need to increase by about 3–4% per year until 2030, compared with a historic 25-year trend of around 1% per year. 65 In 2030–2050, the improvement in carbon productivity would need to accelerate again, to around 6–7% per year, to stay on track. 66
Against this background, the Commission’s research programme has sought to calculate the emissions reductions which the most significant measures and actions set out in this report might have the potential to achieve by 2030, compared with the standard “base case”. All of the actions included in these calculations – in the fields of urban development, land use change, energy investment and specific forms of innovation in manufacturing and services – have multiple economic benefits. That is, all of them provide benefits not just in terms of standard economic indicators, but in other welfare-enhancing factors, such as reductions in rural poverty, improvements in health from better air quality, lower urban traffic congestion and the protection of ecosystem services. While some may have a small net cost considered in narrow economic terms, all can therefore make a strong claim to contribute to higher-quality growth. Another way of putting this is that governments, cities and businesses would have strong reasons to implement them even without consideration of their climate change benefits.
In total, the emissions reductions estimated to be available from the principal measures and actions described in this report add up to 14–24 Gt CO2e, depending on the extent to which the measures are implemented (see Figure 4). This range is equivalent to at least 50% and potentially up to 90% of the emissions reductions needed by 2030, as discussed above, for a two-thirds or better chance of keeping global average warming below 2°C. It must be stressed that the high end of the range would require early, broad and ambitious implementation of those measures and actions. That, in turn, would require decisive policy change and leadership, and rapid learning and sharing of best practice, combined with strong international cooperation, particularly to support developing countries’ efforts.
Calculations of this kind cannot be precise, which is why the figures come with a broad range. They depend on assumptions about what happens in the “base case”, how far specific kinds of measures can be implemented and at what cost, the level of emissions they will generate, the underlying economic conditions (including growth rates and energy prices), and how rapidly technological changes may occur. They also depend on judgements of how the multiple economic benefits of these measures and actions should be valued. But with all these caveats, the figures do provide an indication of the scale of reductions potentially available.
On their own, these measures would not be sufficient to achieve the full range of emissions reductions likely to be needed by 2030 to prevent dangerous climate change. But this report has not sought to examine every currently available option for emissions reduction. By the second half of the 2020s, technological change will almost certainly have led to new possibilities not known today. Thus, it is more or less impossible to estimate the economic costs and benefits of all the additional emissions reductions which may be required by 2030.
But it is clear that achieving the total mitigation needed may require actions with net economic costs. Buildings will have to be more deeply retrofitted with energy efficiency measures than could be justified otherwise. Coal- and gas-fired power stations will have to be retired early, or fitted with carbon capture and storage (CCS) technology whose sole purpose is the reduction of greenhouse gas emissions. Industrial, agricultural and transport emissions will need stronger reductions. These costs will be the “pure” costs of reducing severe climate risk, justifiable only for that reason.
Most of the economic models which have attempted to estimate the net costs of achieving a likely 2°C pathway suggest that they are relatively small, amounting to 1–4% of GDP by 2030. 68 They are almost certainly outweighed by the future economic damages associated with warming of more than 2°C that they would avoid. Still, the likelihood that actions with net costs will be needed suggests that investment in R&D on key technologies such as CCS should be scaled up considerably today.
The areas on which this report focuses involve the fundamental drivers of both growth and emissions over the long term. The low-carbon transition will not end in 2030. Much deeper reductions will be required in later years, to take global emissions down to less than 20 Gt CO2e by 2050 and near zero or below in the second half of the century.69 The measures and actions proposed in this report would help countries lay the groundwork by 2030 – in urban policy and design, land use, energy systems, economic policy, finance and technological innovation – to facilitate further climate action from 2030 onward.
The research undertaken for the Commission has sought to arrive at some broad, preliminary estimates of the scope for countries to undertake reforms and investments that are likely to yield significant economic, health and other benefits, while also helping curb greenhouse gas emissions. It draws upon a survey of relevant technical literature to arrive at monetary estimates of the multiple benefits per tonne of CO2 abated, related to the following actions:
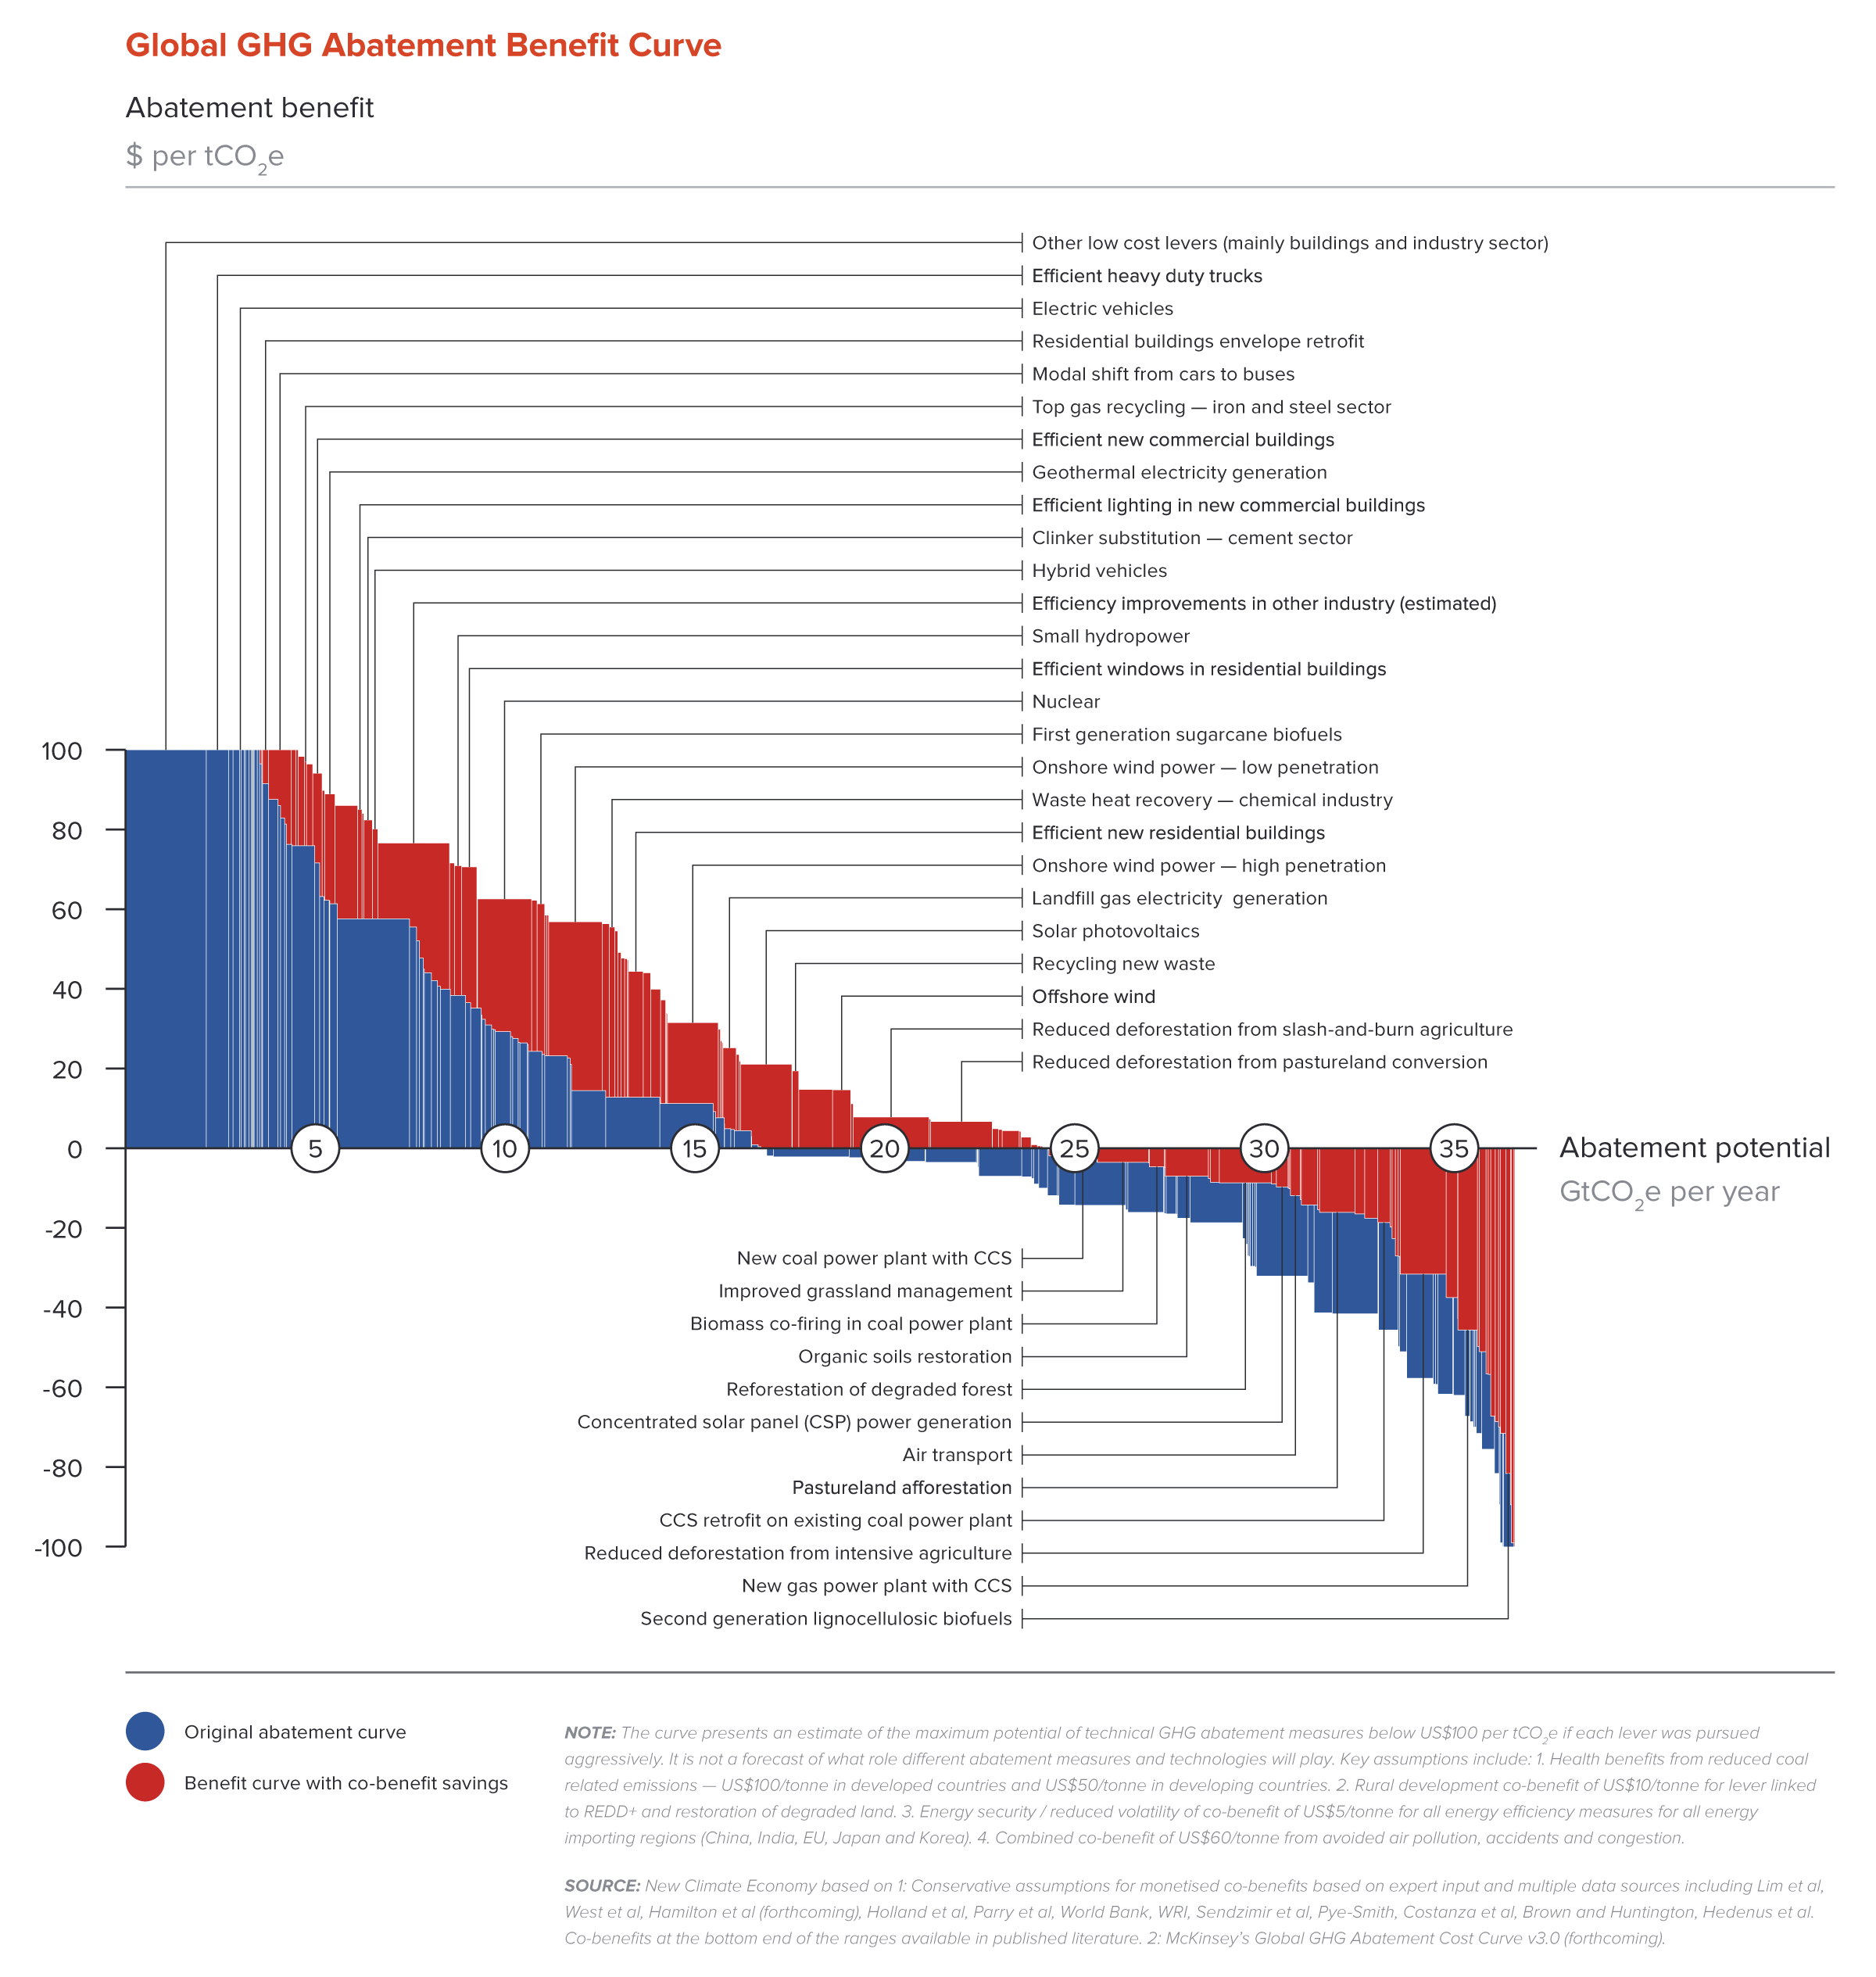
The results are presented by adjusting the Marginal Abatement Cost Curve (MACC) developed by McKinsey & Company. 71 Each of the blue bars in Figure 5 shows the estimated incremental cost in 2030, relative to the high-carbon alternative, of abating an extra tonne of CO2 through a specific technique or action, and the total technical abatement potential it offers. The incremental cost estimate per tonne in 2030 is based on the difference in operating and annualised capital costs between the low- and high-carbon alternatives, net of any potential savings associated with the shift to low-carbon. The red bars show the additional co-benefits associated with various abatement options, such as the health benefits from reduced local air pollution. The original McKinsey cost curve is inverted, so that methods with net benefits appear above the axis and those with net costs below, and the value of the multiple benefits is included where relevant. Thus, the chart becomes a “marginal abatement benefits curve”.
The curve shows that not only are there many abatement options that create net benefits in narrow economic terms, but there are many more – and the economic welfare gain becomes significantly larger – once co-benefits are included. A number of options with net costs in the “narrow” sense become net benefits when co-benefits are taken into account, such as reduced deforestation, recycling of new waste, and offshore wind. For energy-efficiency options, the inclusion of co-benefits can as much as triple the overall benefit.
The quantification of co-benefits undertaken here is of an exploratory nature. The coverage of co-benefits is incomplete, and various implementation issues have not been taken into account. The approach does not incorporate transaction costs, nor does it attempt to show how different sequencing or combinations of measures might give better overall results. However, it does provide a directional sense of which measures might be more attractive and cost-effective, as well as their rough contribution to meeting 2030 abatement goals. The analysis strengthens the case that policy-makers have a broad array of reform and investment options to further economic welfare while abating GHG emissions. This analysis may be particularly helpful for highlighting options where narrowly defined economic benefits are low or negative, but where the co-benefits are significant.
The case for acting to drive growth and climate risk reduction together is very strong. But time is not on the world’s side. The next 10-15 years will be critical.
Major shifts in the structure of economies are not unprecedented. Over the last 30 years, many developed and developing countries have undergone structural economic transformations. The evidence suggests that both well-functioning markets and well-governed public institutions are vital. Public debate, broad political support and thriving civil society organisations can make a huge difference to the chances of success.
The role of businesses in this transition is particularly important. Many companies, of all sizes in all countries, have already begun to move onto low-carbon and climate-resilient paths. Many of those that have gone furthest have found the outcomes powerfully positive for their “bottom lines”, reducing input costs, stimulating innovation and helping to address other risks. 73 Many business actions require government regulation or incentives to make them feasible – but it is incumbent on responsible companies to support the adoption of those policy frameworks, rather than oppose them, as is often the case. Many companies have made progress in reporting on their environmental and social impacts. But such reporting remains optional and in many cases partial. It now needs to be standardised and integrated into core financial reporting requirements.
This needs to be part of a more comprehensive reframing of the rules and norms of economic life. The metrics which governments, businesses, finance institutions and international organisations use to assess their performance, and the risks to which they are exposed, need routinely to incorporate a more sophisticated understanding of how economic and business outcomes relate to environmental impact. 74
Above all, a global transition to a low-carbon and climate-resilient development path will need to be underpinned by an international agreement committing countries to this collective economic future. Such an agreement could act as a powerful macroeconomic instrument, reinforcing domestic policy and sending a strong and predictable signal to businesses and investors about the future direction of the global economy. The signalling effect of such an agreement would be valuably increased if it included a long-term goal to reduce net GHG emissions to near zero or below by the second half of this century. 75 The agreement must be equitable, and developed countries must provide strong climate finance to developing countries, for adaptation, mitigation and capacity-building.
Each chapter of this report makes recommendations in specific areas of policy and action; several are included in the summaries in Part II. The recommendations have been distilled into a 10-point Global Action Plan, presented in Part III.
The wealth of evidence presented by this report shows that there is now huge scope to meet countries’ economic and social goals while also reducing climate risk. Economic leaders have a remarkable opportunity to achieve better growth and a better climate.

Cities are crucial to both economic growth and climate action. Urban areas are home to half the world’s population, but generate around 80% of global economic output, 76 and around 70% of global energy use and energy-related GHG emissions. 77 Over the next two decades, nearly all of the world’s net population growth is expected to occur in urban areas, with about 1.4 million people – close to the population of Stockholm – added each week. 78 By 2050, the urban population will increase by at least 2.5 billion, reaching two-thirds of the global population. 79
The stakes for growth, quality of life and carbon emissions could not be higher. The structures we build now, including roads and buildings, could last for a century or more, setting the trajectory for greenhouse gas emissions at a critical time for reining these in.
Given the long-lived nature of urban infrastructure, the way in which we build, rebuild, maintain and enhance the world’s growing cities will not only determine their economic performance and their citizens’ quality of life; it may also define the trajectory of global GHG emissions for much of the rest of the century. This chapter takes stock of cities’ increasing contribution to both economic growth and climate change, examines the dominant patterns of development today, and presents an alternative pathway, as well as the policies needed to support and scale it up.
We focus in particular on three categories of cities:
Research carried out for the Commission shows that, on current trends, these cities combined will account for 60% of global GDP growth between now and 2030. They will account for close to half of global energy-related GHG emissions. Some 300 emerging cities, with populations between 1 million and 10 million, will account for over half of this growth. The question for mayors, as well as for policy-makers in economics, finance, urban planning and environmental ministries, is how to plan urban development in a way that improves economic performance and quality of life while reducing GHG emissions.
A large share of urban growth around the world involves unplanned, unstructured urban expansion, with low densities and high rates of car use. If current development trends were to continue, the global area of urbanised land could triple from 2000 to 2030, 80 the equivalent to adding an area greater than the size of Manhattan every day. At the same time, the number of cars could double, from 1 billion today to 2 billion. 81
This sprawling pattern of expansion has major costs. It can double land used per housing unit, increase the costs of providing utilities and public services by 10–30% or more, and increase motor travel and associated costs by 20–50%. 82 In fast-growing low- and middle-income countries, sprawled patterns can actually double or triple many costs, because they often have to import construction equipment. Sprawl also results in greater congestion, accident and air pollution costs; locks in inefficiently high levels of energy consumption, and makes it harder to implement more efficient models of waste management and district heating.
New modelling for this report shows that the incremental external costs of sprawl in the United States are about US$400 billion per year, due to increased costs of providing public services, higher capital requirements for infrastructure, lower overall resource productivity, and accident and pollution damages. 83 Costs can be even more acute in rapidly urbanising countries where resources are more limited. In China, urban sprawl has reduced productivity gains from agglomeration and specialisation, and led to much higher levels of capital spending than necessary to sustain growth. 84 Research from 261 Chinese cities in 2004, for example, suggested that labour productivity would rise by 8.8% if employment density doubled. 85
New analysis reviewed by the Commission shows that even in this context, cities around the world have significant opportunities in the next 5–10 years to boost resource productivity and reduce GHG emissions through economically attractive investments in the buildings, transport and waste sectors. However, without broader structural shifts in urban design and transport systems, the benefits of those measures would quickly be overwhelmed by the impacts of sustained economic and population expansion under business-as-usual patterns. In fast-growing Emerging Cities in particular, the evidence suggests energy savings and emission reductions could be erased within five years or less. 86
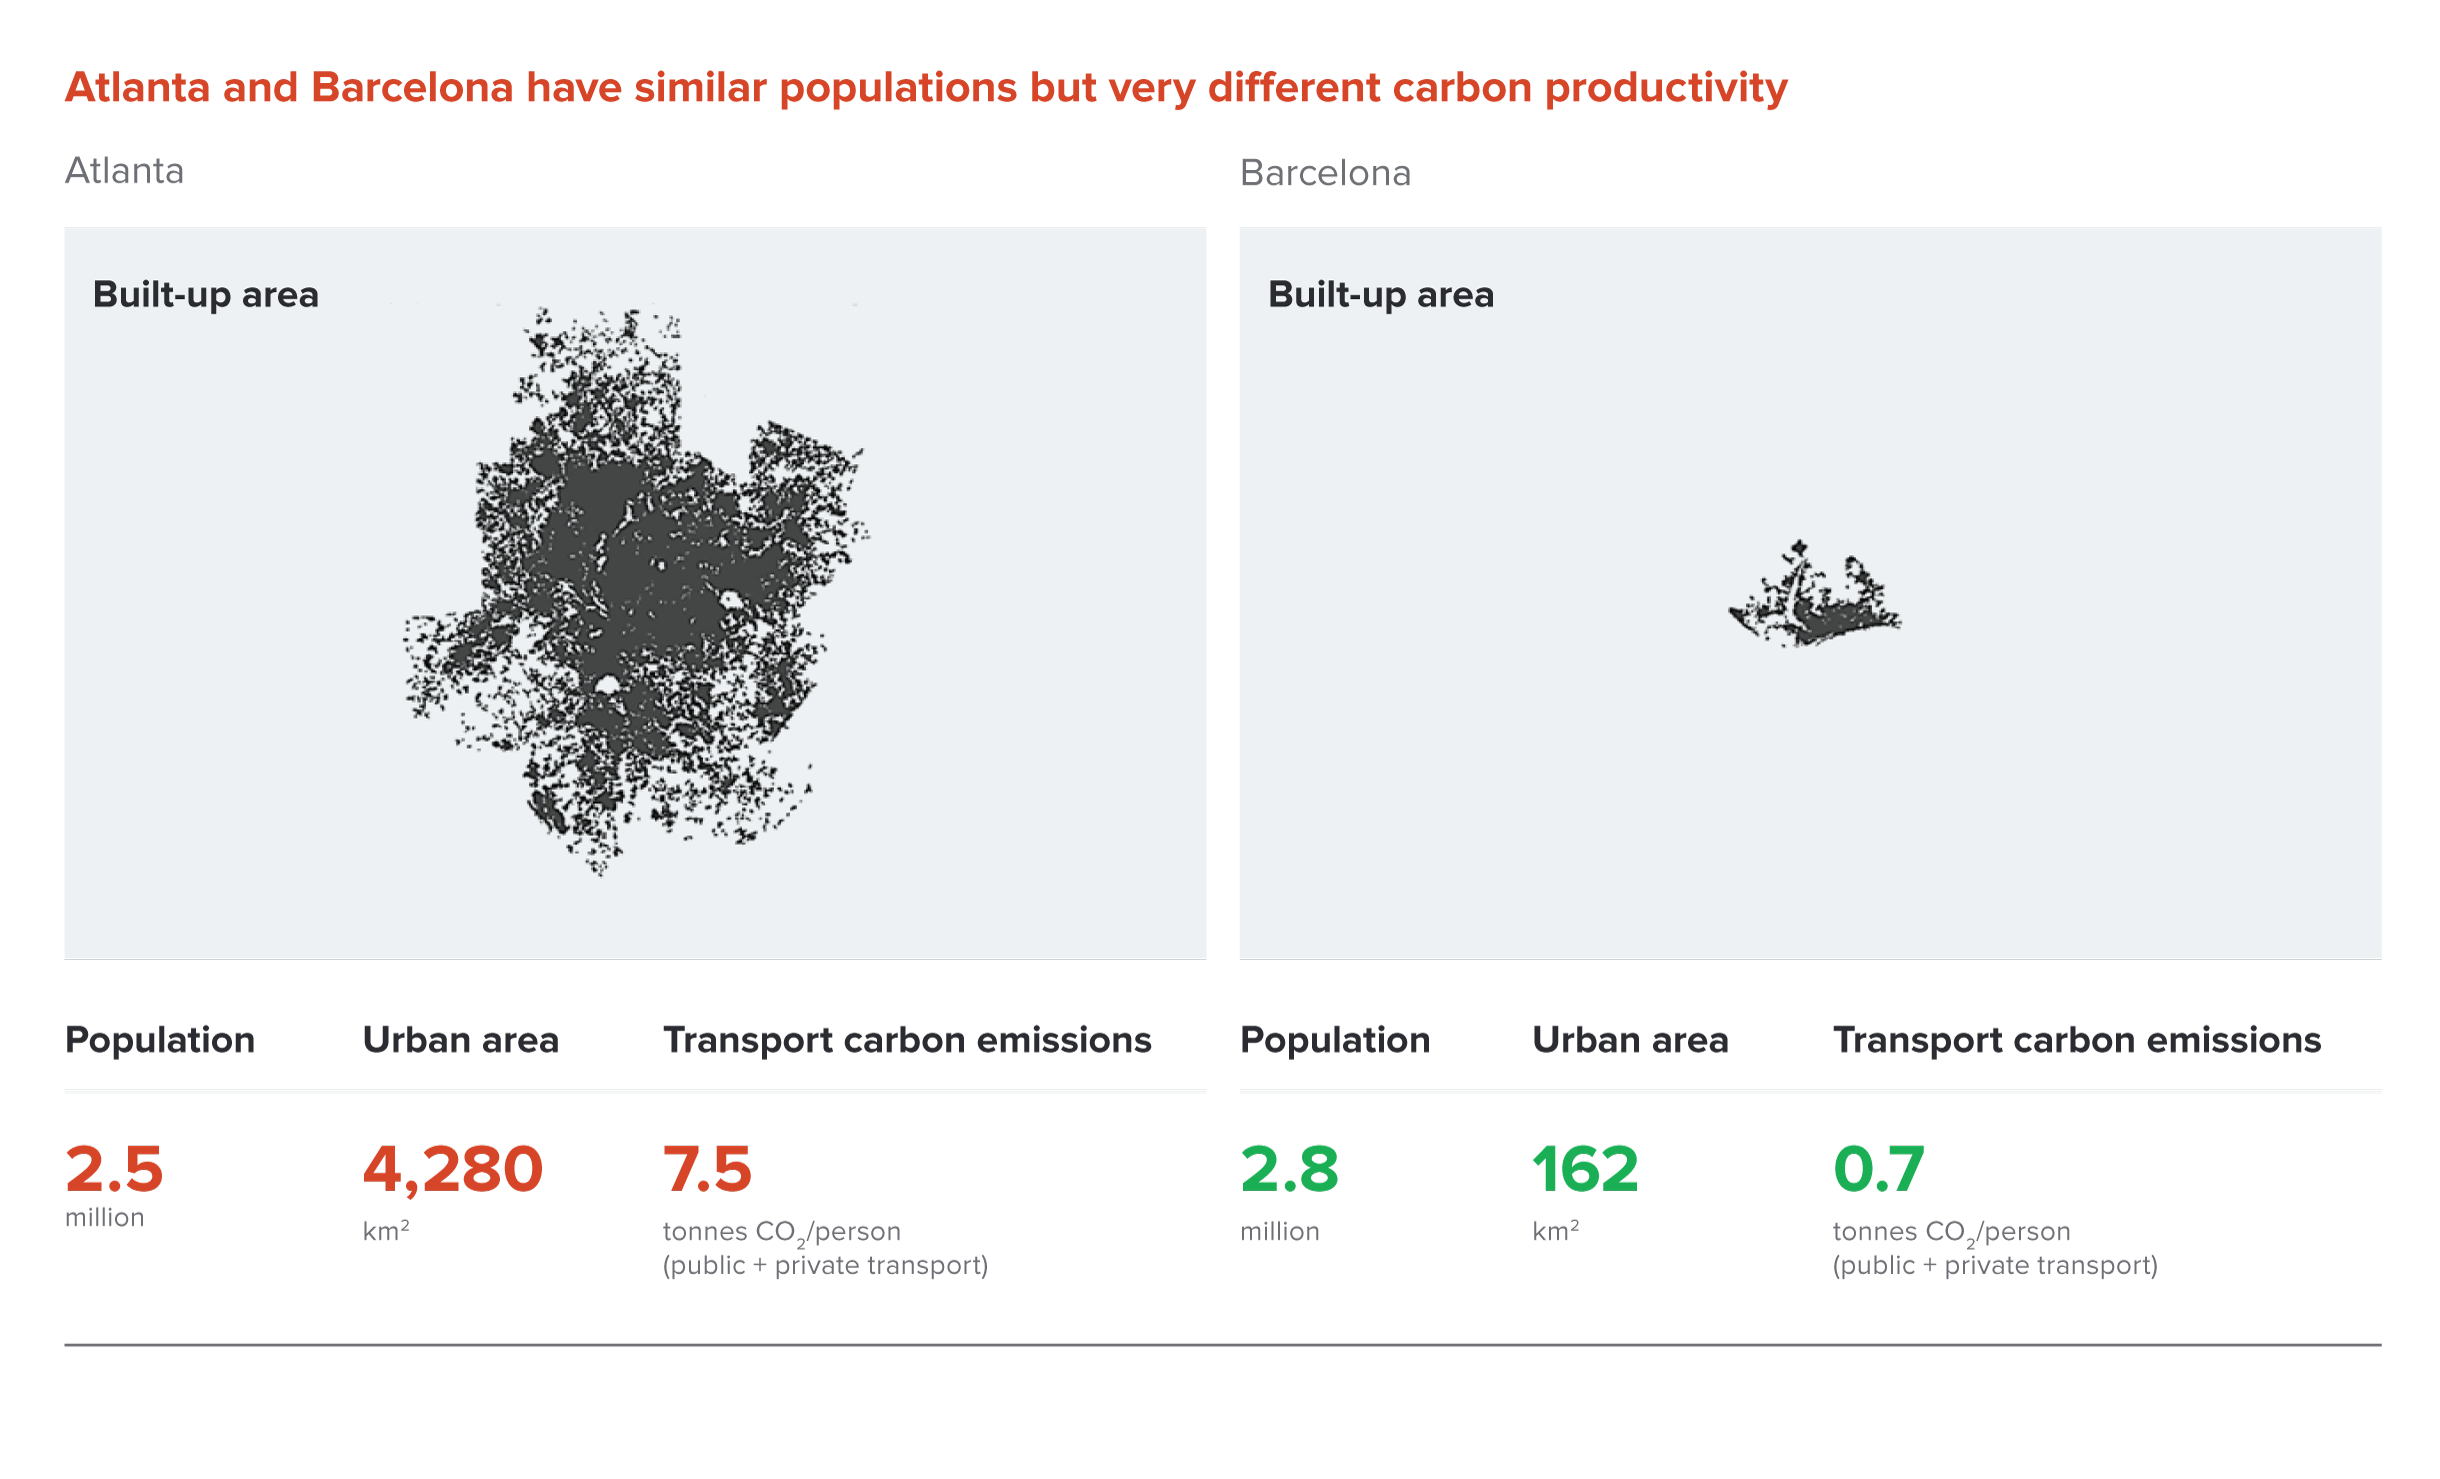
Thus, to unlock a new wave of sustained, long-term urban productivity improvements, we need a systemic shift to more compact, connected and coordinated development. Cities that meet these criteria are more productive, socially inclusive, resilient, cleaner, quieter and safer. They also have lower GHG emissions – a good example of the benefits of pursuing economic growth and climate change mitigation together. Figure 6, for example, contrasts the land use and GHG implications of urban development patterns followed in the US city of Atlanta and in Barcelona, Spain.
Bertaud, A. and Richardson, A.W (2004), Transit and density: Atlanta, the United States and Western Europe, Figure 17.2 on p.6, available at http://courses.washington.edu/
Kenworthy (2003), Transport Energy Use and Greenhouse Gases in Urban Passenger Transport Systems: A Study of 84 Global Cities, Third Conference of the Regional Government Network for Sustainable Development, Notre Dame University, Fremantle, Western Australia, September 17-19, 2003. Figure 1 on p.18 cited in Lefevre, B. (2009), Urban Transport Energy Consumption: Determinants and Strategies for its Reduction, S.A.P.I.EN.S 2(3): 1–32. Figure 6, available at http://sapiens.revues.org/914]
The alternative to unplanned, unstructured urban expansion is a more efficient urban development model, based on managed growth which encourages higher densities, mixed-use neighbourhoods, walkable local environments, and – in Global Megacities and Mature Cities – the revitalisation and redevelopment of urban centres and brownfield sites, complemented by green spaces. This model prioritises high-quality public transport systems to make the most of compact urban forms and to reduce car dependence and congestion. It also boosts resource efficiency through “smarter” utilities and buildings. It has the potential to reduce urban infrastructure capital requirements by more than US$3 trillion over the next 15 years. 87 Fast-growing Emerging Cities and small urban areas have a particularly important opportunity to adopt this model from the outset, learning from others’ experience.
Shifting towards this alternative model would unlock significant medium- to long-term economic and social benefits. It would boost infrastructure productivity through the agglomeration effects of greater density, improve air quality, and deliver substantial cost savings in the transport sector. Estimates for the United States suggest that transit-oriented urban development could reduce per capita car use by 50%, reducing household expenditures by 20%. 88 At significantly lower fuel prices, sprawling Houston spends about 14% of its GDP on transport compared with 4% in Copenhagen and about 7% in many Western European cities. (Notably, Houston is now making ambitious efforts to overcome the legacy of sprawl through urban renewal and sustained investment in public transport systems.) 89
Adopting a compact, transit-oriented model in the world’s largest 724 cities, new analysis for the Commission shows, could reduce GHG emissions by up to 1.5 billion tonnes CO2e per year by 2030, mostly by reducing personal vehicle use in favour of more efficient transport modes. While achieving such savings would require transformative change, it would lay the foundation for even greater, sustained resource savings and emission reductions over the following decades.
In fact, such a shift is already happening. Re-densification is taking place in cities as diverse as London, Brussels, Tokyo, Hamburg, Nagoya and Beijing. More than 160 cities have implemented bus rapid transit (BRT) systems, which can carry large numbers of passengers per day at less than 15% of the cost of a metro.90 The BRT in Bogotá, Colombia, for example, carries up to 2.1 million passengers per day, complemented by a citywide network of bicycle paths that connect residents to public transport, community spaces and parks. 91 China will have 3,000km of urban rail networks by 2015.92 Nearly 700 cities had bike-sharing schemes at the end of 2013, up from five in 2000.93
From Copenhagen, to Hong Kong, to Portland, Oregon, in the US, cities are also showing how they can build prosperity, improve air quality, reduce GHG emissions all at once through more compact, connected and coordinated urban growth models. Stockholm reduced emissions by 35% from 1993 to 2010 while growing its economy by 41%, one of the highest growth rates in Europe. 94 Curitiba is one of the most affluent cities in Brazil, but has 25% lower per capita GHG emissions and 30% lower fuel consumption than the national average due to its groundbreaking approach to integrated land use and transport planning. 95
Countries need to prioritise better-managed urban development and increased urban productivity as key drivers of growth and climate goals. This is especially the case for countries with rapidly urbanising populations, as current institutional arrangements often result in urban development being driven by other national priorities. Here, coordination and cooperation between national and regional governments and city leaders is essential.
Several countries are already making major policy changes to promote more compact, mixed-use land development, contain urban sprawl, maximise resource efficiency, and curtail the negative externalities of pollution, congestion and CO2 emissions. A high-profile example is China’s New National Urbanisation Plan, which places urban policy at the heart of Chinese decision-making. 96
They should also provide greater fiscal autonomy for cities, potentially linked to economic, social and environmental performance benchmarks, and consider setting up a special-purpose financing vehicle at the national level to support cities’ efforts to become more compact, connected and coordinated, with appropriate private-sector participation. Existing infrastructure funding should be redirected to support this transition.
Building better, more productive cities is a long-term journey. It requires persistence in several key areas to shift away from business-as-usual urban expansion, with countries, regions and cities working together. As a first step, cities should seize some of the numerous opportunities available to boost resource productivity in the short- to medium term, in sectors as diverse as buildings, transport and waste management. The evidence suggests that these smaller steps could build momentum for broader, longer-term reform, especially in capacity-constrained cities.
Only about 20% of the world’s 150 largest cities have even the basic analytics needed for low-carbon planning. 97 These efforts should be supported by regulatory reform to promote higher-density, mixed-use, infill development, and new measures such as efficient parking practices.
It is also crucial to change transport incentives.
They should also consider charges on land conversion and dispersed development, and measures that place a higher price on land than on buildings such as land taxes and development taxes. These reforms can raise revenue to invest in public transport and transit-oriented development.
In addition, there is a need for new mechanisms to finance upfront investments in smarter urban infrastructure and technology, such as greater use of land value capture, municipal bond financing, and investment platforms to prepare and package investments to attract private- sector capital. This should be complemented by more effective and accountable city-level institutions. The chapter discusses these topics in detail.
The international community also has a key role to play in fostering better-managed urban growth, both by building and sharing knowledge about best practices, and by steering finance towards compact, connected and coordinated urbanisation, and away from sprawl.
The initiative should: build on the existing work of key international organisations already working in this field, including city networks such as C40 and ICLEI (Local Governments for Sustainability), and involve rapidly urbanising countries, mayors and business leaders. Key activities could include reviewing institutional options for systematic collection of city-level data, developing urbanisation scenarios and best practice guidance, creating an international standard for integrated municipal accounting, and targeted capacity-building.
Only 4% of the 500 largest cities in developing countries are now deemed creditworthy in international financial markets; every US$1 spent to correct this can leverage more than US$100 in private-sector finance. 98 The new facility should build on and scale-up the existing programme of the World Bank, and assist cities in both developing and developed countries.
The banks should work with client and donor countries to redirect overseas development assistance and concessional finance towards supporting integrated citywide urban strategies and investment in smarter infrastructure and new technology. Greater consideration should also be given to redirecting overall MDB funding to account for the growing importance of cities in economic development in rapidly urbanising countries, as well as the scaling-up of support to help cities prepare and package urban infrastructure investments.

Rapid global population growth, urbanisation, rising incomes and resource constraints are putting enormous pressure on land and water resources used by agriculture and forests, which are crucial to food security and livelihoods. Roughly a quarter of the world’s agricultural land is severely degraded, 99 and forests continue to be cleared for timber and charcoal, and to use the land for crops and pasture. 100 Key ecosystem services are being compromised, and the natural resource base is becoming less productive. At the same time, climate change is posing enormous challenges, increasing both flood and drought risk in many places, and altering hydrological systems and seasonal weather patterns.
Agriculture, forestry and other land use also account for a quarter of global GHG emissions. 101 Deforestation and forest degradation alone are responsible for about 11% of global GHGs, net of reforestation; 102 the world’s total forest land decreased by an average of 5.2 million ha per year over 2000-2010. 103 Emissions from agriculture, in turn, include methane from livestock, nitrous oxide from fertiliser use, and carbon dioxide (CO2) from tractors and fertiliser production (see Figure 7).
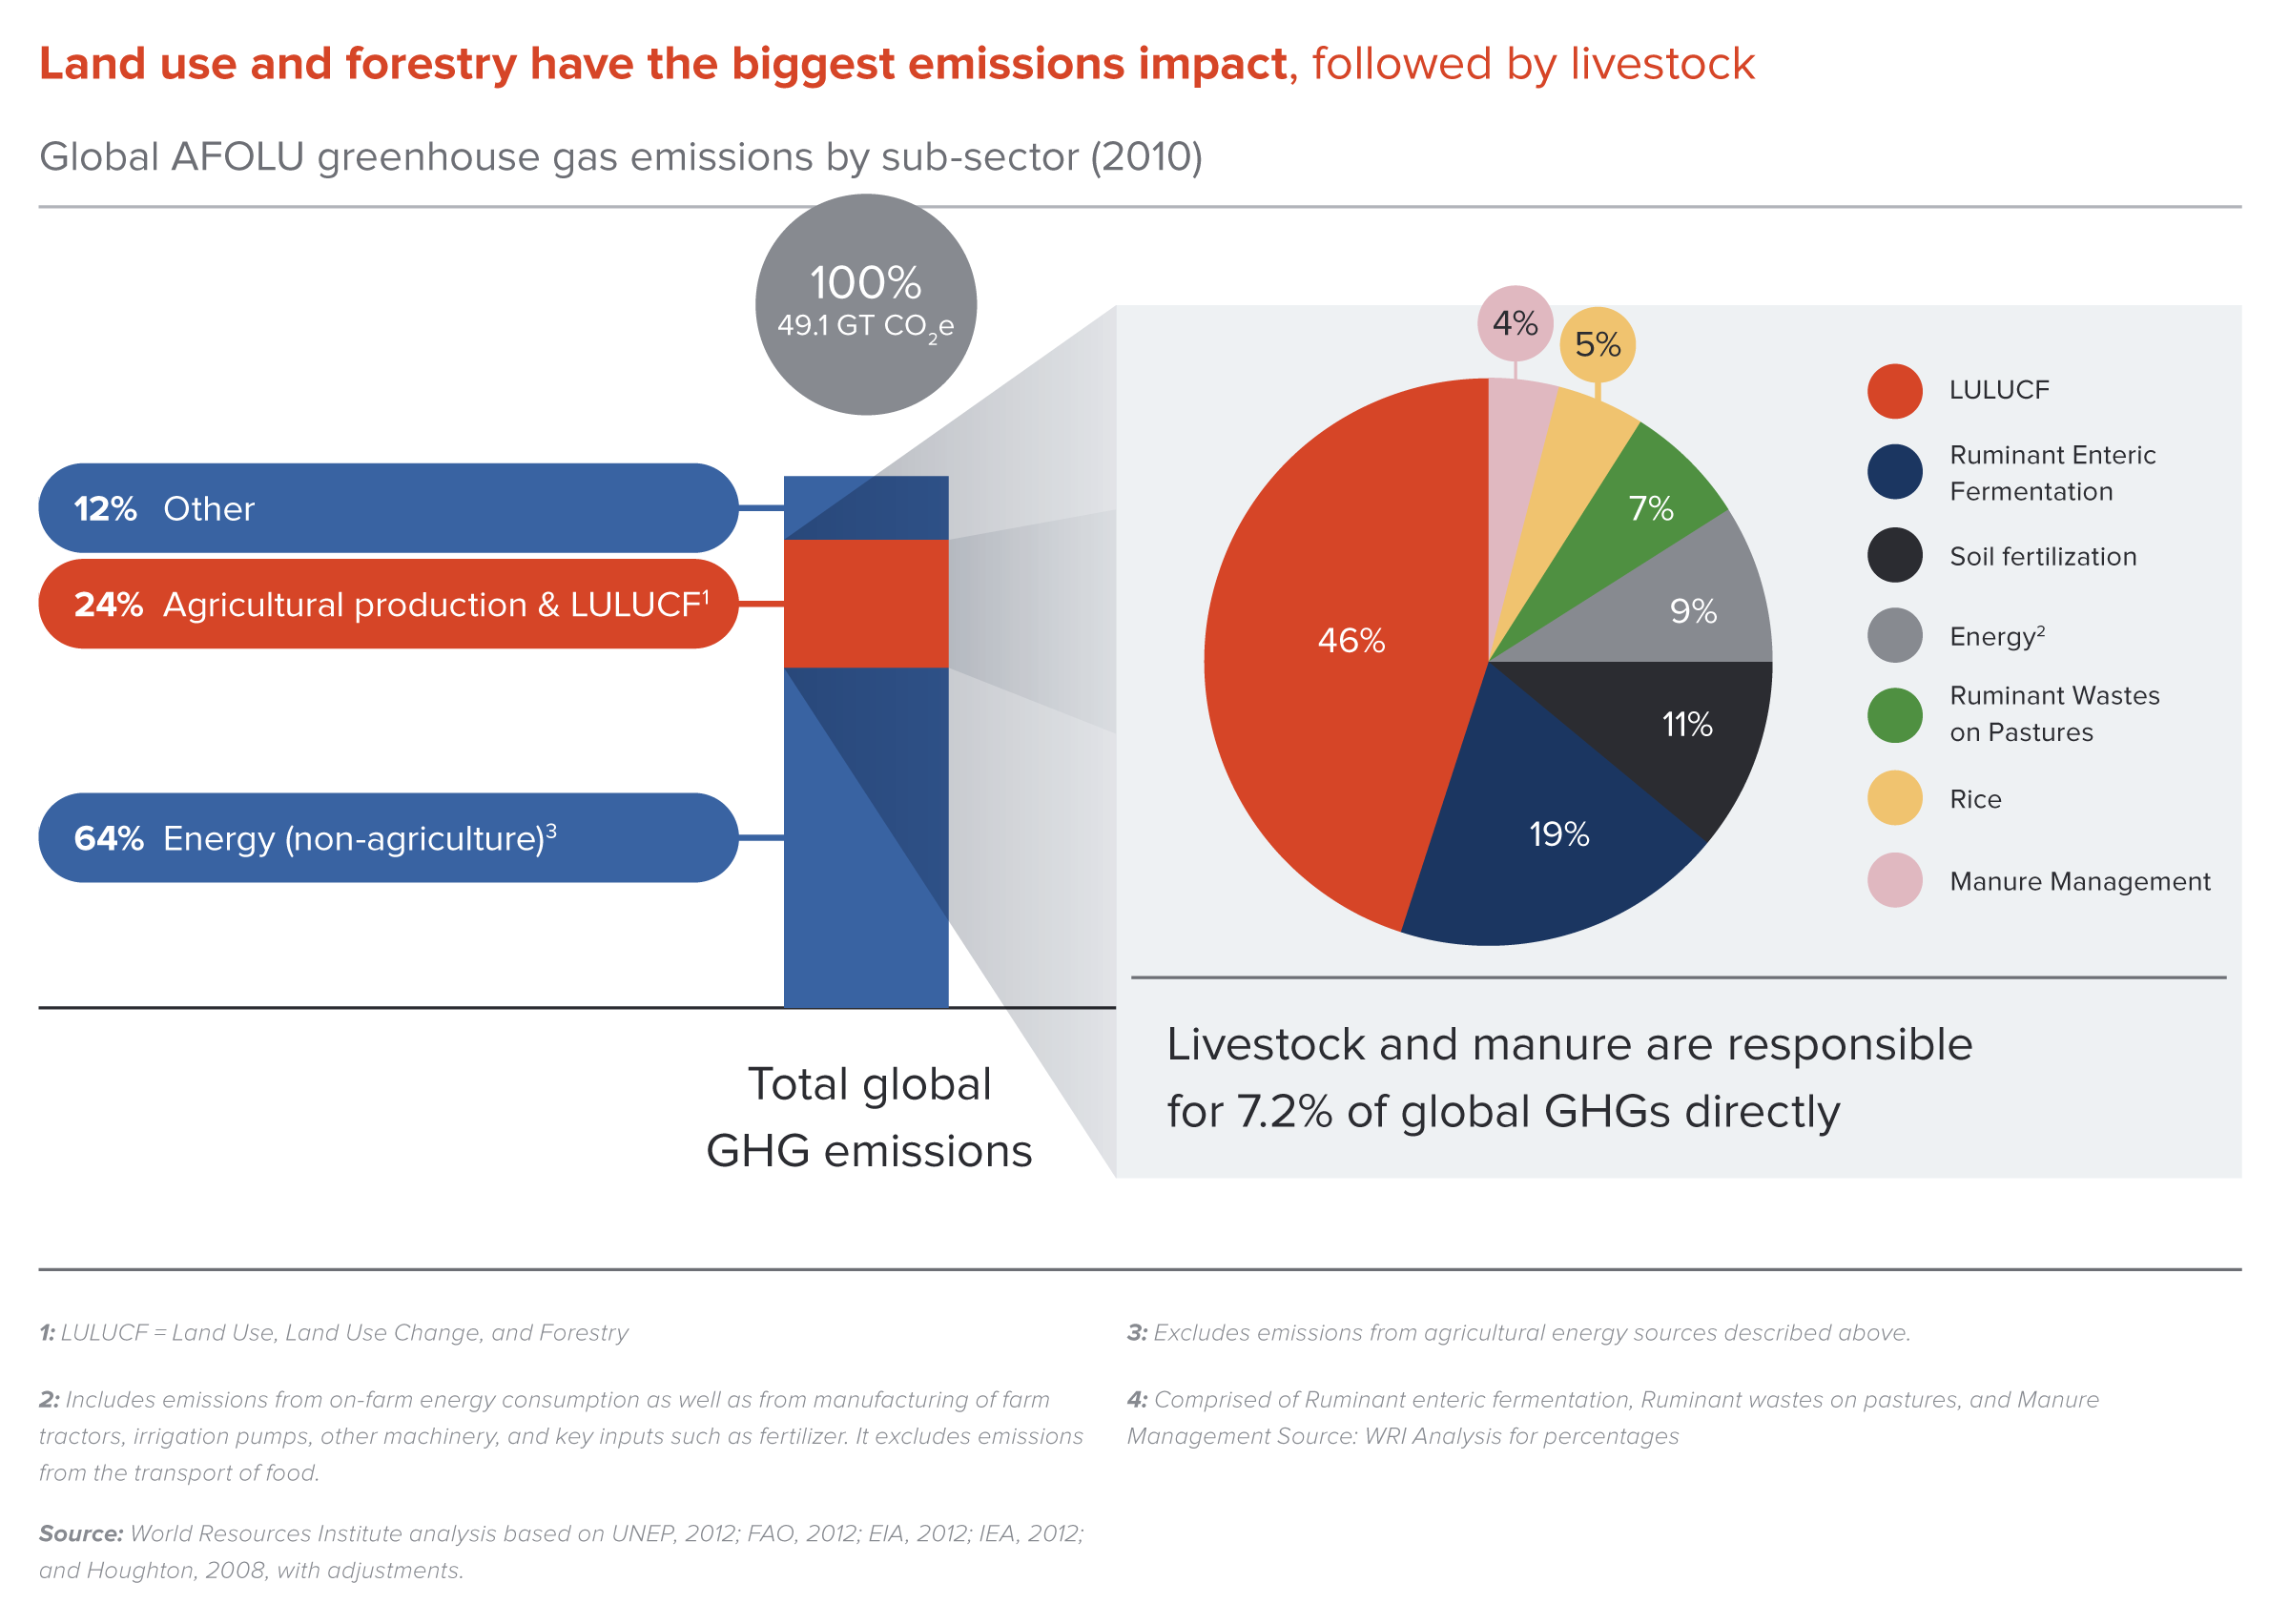
Source: World Resources Institute analysis based on UNEP, 2012; FAO, 2012; EIA, 2012; IEA, 2012; and Houghton, 2008, with adjustments. 104
Those factors combined make agriculture and forests top-priority sectors for climate policy, particularly in tropical countries, which often include substantial areas of carbon-rich forest. They are also crucial to many developing economies: in countries in the US$400–1,800 per capita GDP range (2005$), many of them in Asia, the World Bank found agriculture was 20% of GDP on average; in sub-Saharan Africa, it was 34%, and accounted for almost two-thirds of employment and a third of GDP growth in 1993–2005.105 Globally, 70% of the poorest people live in rural areas and depend on agriculture for their livelihoods, mostly in the tropics. 106
Developing countries are also where more than 80% of the global demand growth for agricultural and forest products will occur over the next 15 years. 107 By 2050, the world’s farms will need to produce 70% more calories than in 2006, mainly due to population growth, rising incomes and changing diets in developing countries. 108 Meeting this new demand will be critical to growth, food security and poverty alleviation; it will also create huge opportunities for businesses – from small farms and local businesses, to multinationals. How this demand is met will be critical to climate outcomes.
The “Green Revolution”– a multi-decade effort to modernise farming in the developing world – boosted crop yields, by developing high-yield grain varieties and sharply increasing the use of agricultural inputs (irrigation water, fertilisers). Many of the measures needed today are more location-specific, addressing issues such as drought, floods, pests and saltwater intrusions. There are already promising innovations, such as “Scuba rice”, which can withstand submersion in water, a common situation as floods increase in South and Southeast Asia. The variety was introduced in India in 2008 and has since been adopted by 5 million farmers in the region.109
For major cereal crops, the research supported by the Consultative Group on International Agricultural Research (CGIAR), a US$1 billion-a-year global partnership, will be invaluable. Public-sector support in individual countries is also crucial, particularly for rice and “orphan crops”– some starchy root crops, vegetables, legumes, etc. – that have little global market value but are local dietary staples. Yet in 2008, governments only spent US$32 billion on agricultural R&D – including US$15.6 billion (2005 PPP) in developing and emerging economies. Private-sector funding added another US$18 billion (2005 PPP), primarily in developed countries.110
There is considerable scope to increase funding for agricultural R&D to increase productivity and resilience, whether through multilateral, regional or national institutions.
One way to free up funds for R&D is to reduce input subsidies (mainly for fertiliser and water). Agricultural subsidies in China rose to US$73 billion in 2012, or 9% of agricultural output; 111 India provided roughly US$28 billion in input subsidies to nitrogenous fertilisers and electricity for pumping agricultural water in 2010. 112 OECD country governments paid farmers US$32 billion based on input use in 2012. 113 Many countries subsidise inputs to try to boost productivity, but they can also lead to waste and environmental damage.
This would incentivise better, more targeted input use, reduce associated pollution and GHG emissions, and save farmers money, since they pay for inputs even if they are subsidised. Potential GHG emission reductions of 200 million tonnes of CO2e per year have been estimated from more efficient use of fertilisers in China alone, 114 and close to 100 million tonnes of CO2e per year from more efficient use of water in India. 115
Halting and reversing land degradation should also be a priority. About one-quarter of agricultural land globally is now severely degraded. 116 Case studies in China, Ethiopia, Mexico, Uganda, Rwanda, Chile and Indonesia found land degradation decreased productivity by 3–7% per year. 117 Well-tested practices can add organic matter to the soil and control water runoff, jointly improving water retention and soil fertility, and increasing carbon storage in soils, plants and trees.
Such approaches consider ecosystems, resource use and human activities across the broader landscape, not just farm-by-farm. They also typically involve planting trees on farms and/or restoring and protecting forested areas around farms. They can be large-scale and capital-intensive, or more narrowly targeted, introducing a handful of proven techniques.
The 1994–2005 Loess Plateau projects in China, which mobilised US$491 million in funding and curbed soil erosion on nearly 1 million ha, are a shining example of large-scale efforts (see figure 8). The projects focused on halting the activities that led to degradation – in particular planting on steep slopes, tree-cutting, and free-range grazing of goats; introduced heavy equipment to build wider and sturdier terraces for grain cultivation, and encouraged farmers to plant trees and to allow marginal land to grow wild again. The projects sharply increased grain yields and lifted more than 2.5 million people out of poverty. Soil carbon storage also increased, mostly due to the restoration of forests and grassland. 118 The project model has since been scaled up to cover large areas of the country, through China’s US$40 billion “Grain for Green” programme.119
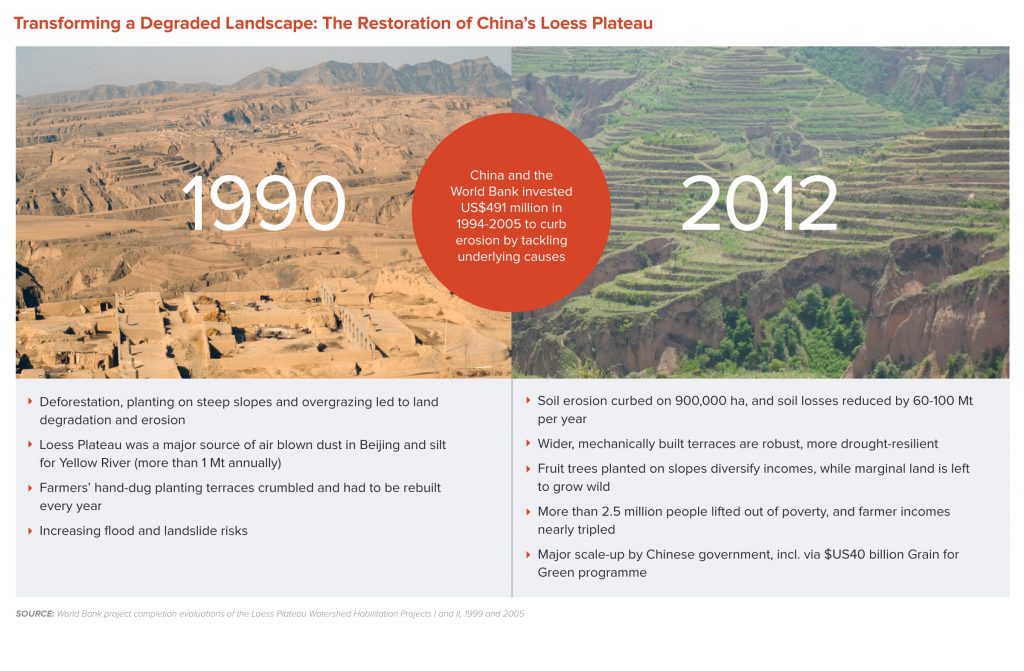
Source: World Bank project completion evaluations of the Loess Plateau Watershed Habilitation Projects I and II, 1999 and 2005. 120
The Maradi and Zinder regions of Niger, meanwhile, show what can be achieved even at a low cost. Farmers interplanted nitrogen-fixing trees on cropland, or allowed roots and stumps to regenerate, increasing tree and shrub cover 10- to 20-fold. Agricultural productivity was significantly increased on 5 million ha of severely degraded farmland, 121 and biodiversity and soil fertility improved across the entire area. Real farm incomes more than doubled, stimulating local non-farm services as well. 122 Similar conditions exist on another 300 million ha of drylands in Africa alone, suggesting considerable potential for scaling.123
Perceptions of increasing climate and market risk following the food price spikes of 2008 have made both governments and smallholder farmers overly risk-averse in the poorer countries. This has hindered adoption of market-oriented policies, investments and technologies that may be essential for sustained increases in farm income. However, failure to pay attention to increased uncertainty can also be catastrophic for the poor. Solid institutions and leadership are needed to encourage collective action; appropriate incentives and more secure property rights are also crucial.
Forests also need much better protection. Demand for timber, pulp and bioenergy is projected to grow over the next 15 years, putting even more pressure on lands currently supporting natural forests. 124 Projections to 2050 indicate a threefold increase in wood removals by volume compared with 2010. 125 Increasing the profitability of alternative land uses, such as through agricultural intensification, also increases pressures to clear land. Yet the value generated by agriculture in former forestlands and by the extraction of forest products also brings costs. Forests are an important form of natural capital, generating economic returns (and climate benefits) for countries, companies and citizens. The ecosystem services that forests provide are especially important to the resilience of agricultural landscapes. Thus, protecting remaining natural forests and restoring forest cover –globally and in individual regions –is a key part of feeding the world and building a resilient economy.
Millions of hectares of forest are being lost or degraded each year, due to agricultural expansion, timber harvesting, extraction for fuelwood or charcoal, mining and road-building. 126 Once trees have been removed, leading to forest degradation, the land is often converted to other uses, such as agriculture –which is what is technically known as deforestation. While forest degradation and deforestation in the forests often go together, the drivers are different and may require differing approaches. 127 The increasing demand for forest products from growth in emerging economies is central to forest degradation, while the decision on whether to allow degraded forest land to regenerate into forest or to convert it to other uses is driven by the financial viability of alternative uses, property rights, and governance of markets and resources.
Problems arise because market prices, tax policies, lending conditions, and commodity procurement practices often do not reflect (or “internalise”) the wider economic value of a forest. These shortcomings are compounded by lack of information, lack of accountability, and in some places, corruption and powerful vested interests. Any form of capital needed to underpin strong economic growth – whether natural, financial or human – cannot be enhanced and used effectively under such market and governance failures.
Policy interventions are needed to address these problems, and there are many successful examples, from Brazil, to Costa Rica, to Korea. Payments for ecosystem services, such as under REDD+, can also play a key role in helping countries preserve their natural capital.
Options for the latter include a results-based REDD+ window (sub-fund) in the Green Climate Fund, 128 or countries counting emission reductions from REDD+ as part of their “nationally determined contributions” under the 2015 climate agreement. Over time, carbon markets are expected to play an increasing role. Law enforcement and the verification necessary for results-based finance are greatly facilitated by the convergence of low-cost satellite imagery, cloud computing, high-speed internet connectivity, smartphones and social media. These are ushering in a new world of “radical transparency”, where what is happening in a far-away forest can now be known close to home.
Ambitious forest restoration targets are needed as well.
This is consistent with Aichi Target 15, which calls for restoring 15% of degraded ecosystems, 129 and could generate net benefits on the general order of US$170 billion per year from watershed protection, improved crop yields, and forest products. 130 Pathways for restoration at this high level would need to include agroforestry and mosaic restoration in agricultural areas (perhaps on degraded steep slopes of limited commercial value), in addition to assisted or natural regeneration of forests. This would sequester about 1–3 Gt CO2e per year, depending on the pathways used and biomes prevalent in the areas restored. 131
To ease pressure on the land, demand-side measures are also important. On a caloric basis, a quarter of the world’s food is now lost or wasted between farm and fork. For example, food waste reduction measures in developed countries could save US$200 billion per year by 2030, and reduce emissions by at least 0.3 Gt of CO2e. 132 Policy-makers should also work to reduce demand for food crops for biofuels and promote a shift in diets, away from red meat especially.
Our report estimates that following the above recommendations in agriculture, forests and land use change would very conservatively yield an abatement range of between 4.2 to 10.4 Gt CO2e per year in 2030, with an expectation of 7.3 Gt CO2e. The main sub-components of this estimate are: boosting agricultural productivity through a focus on “climate-smart agriculture” innovation (0.6–1.1 Gt); improved forest governance and conservation measures to achieve zero net deforestation, supported by REDD+ (1.6–4.4 Gt); restoring 150 million ha of degraded agricultural land and 350 million ha of degraded forest landscapes, for a total of 500 million ha (1.8–4.5 Gt); and reduced food waste (0.2–0.4 Gt).

We are in a period of unprecedented expansion of energy demand. Global energy use has grown by more than 50% since 1990, 133 and must keep growing to support continued development. As much as a quarter of today’s energy demand was created in just the last decade, and since 2000, all the net growth has occurred in non-OECD countries, more than half of it in China alone. 134 Past projections often failed to anticipate these dramatic shifts, which nonetheless have affected the energy prospects of nearly all countries. The future is now even more uncertain, as projections show anything from a 20% to 35% expansion of global energy demand over the next 15 years. 135
A major wave of investment will be required to meet this demand: around US$45 trillion will be required in 2015–2030 for key categories of energy infrastructure. 136 How that money is spent is critically important: it can help build robust, flexible energy systems that will serve countries well for decades to come, or it can lock in an energy infrastructure that exposes countries to future market volatility, air pollution, and other environmental and social stresses. Given that energy production and use already accounts for two-thirds of global GHG emissions, 137 and those emissions continue to rise, a great deal is at stake for the climate as well.
The next 15 years offer an opportunity to create better energy systems that also reduce future climate risk. Achieving this will require a multi-faceted approach. The starting point must be to get energy pricing right, implementing energy prices that enable cost recovery for investment and less wasteful use of energy, and removing subsidies for fossil fuel consumption, production and investment. Other, complementary initiatives also will be required. One key task is to increase resource efficiency and productivity – to make the most of our energy supplies. Some countries have already made significant gains in this regard, but there is much untapped potential. It also will be necessary to expand our energy supply options. Innovation in technology, as well as business models, financing systems, and regulatory frameworks, is already doing this, from unconventional gas and oil, to the rapid growth of renewable energy technologies.
Coal has been abundant and affordable for many generations, and in several fast-growing economies, it remains the default option for rapid expansion of the power supply and for heavy industry. But conditions are changing, driven by fast-rising demand and a sharp increase in coal trade. Prices are twice the levels that prevailed historically,138 with projections for continued high levels in the range of US$85–140 per tonne, even as other options, notably shale gas in the US and renewable energy sources globally, have fallen in cost. The future security advantage of coal is also less clear than before. India has imported more than 50% of new coal requirements in recent years, and may face still higher import dependence without a change of course. 139
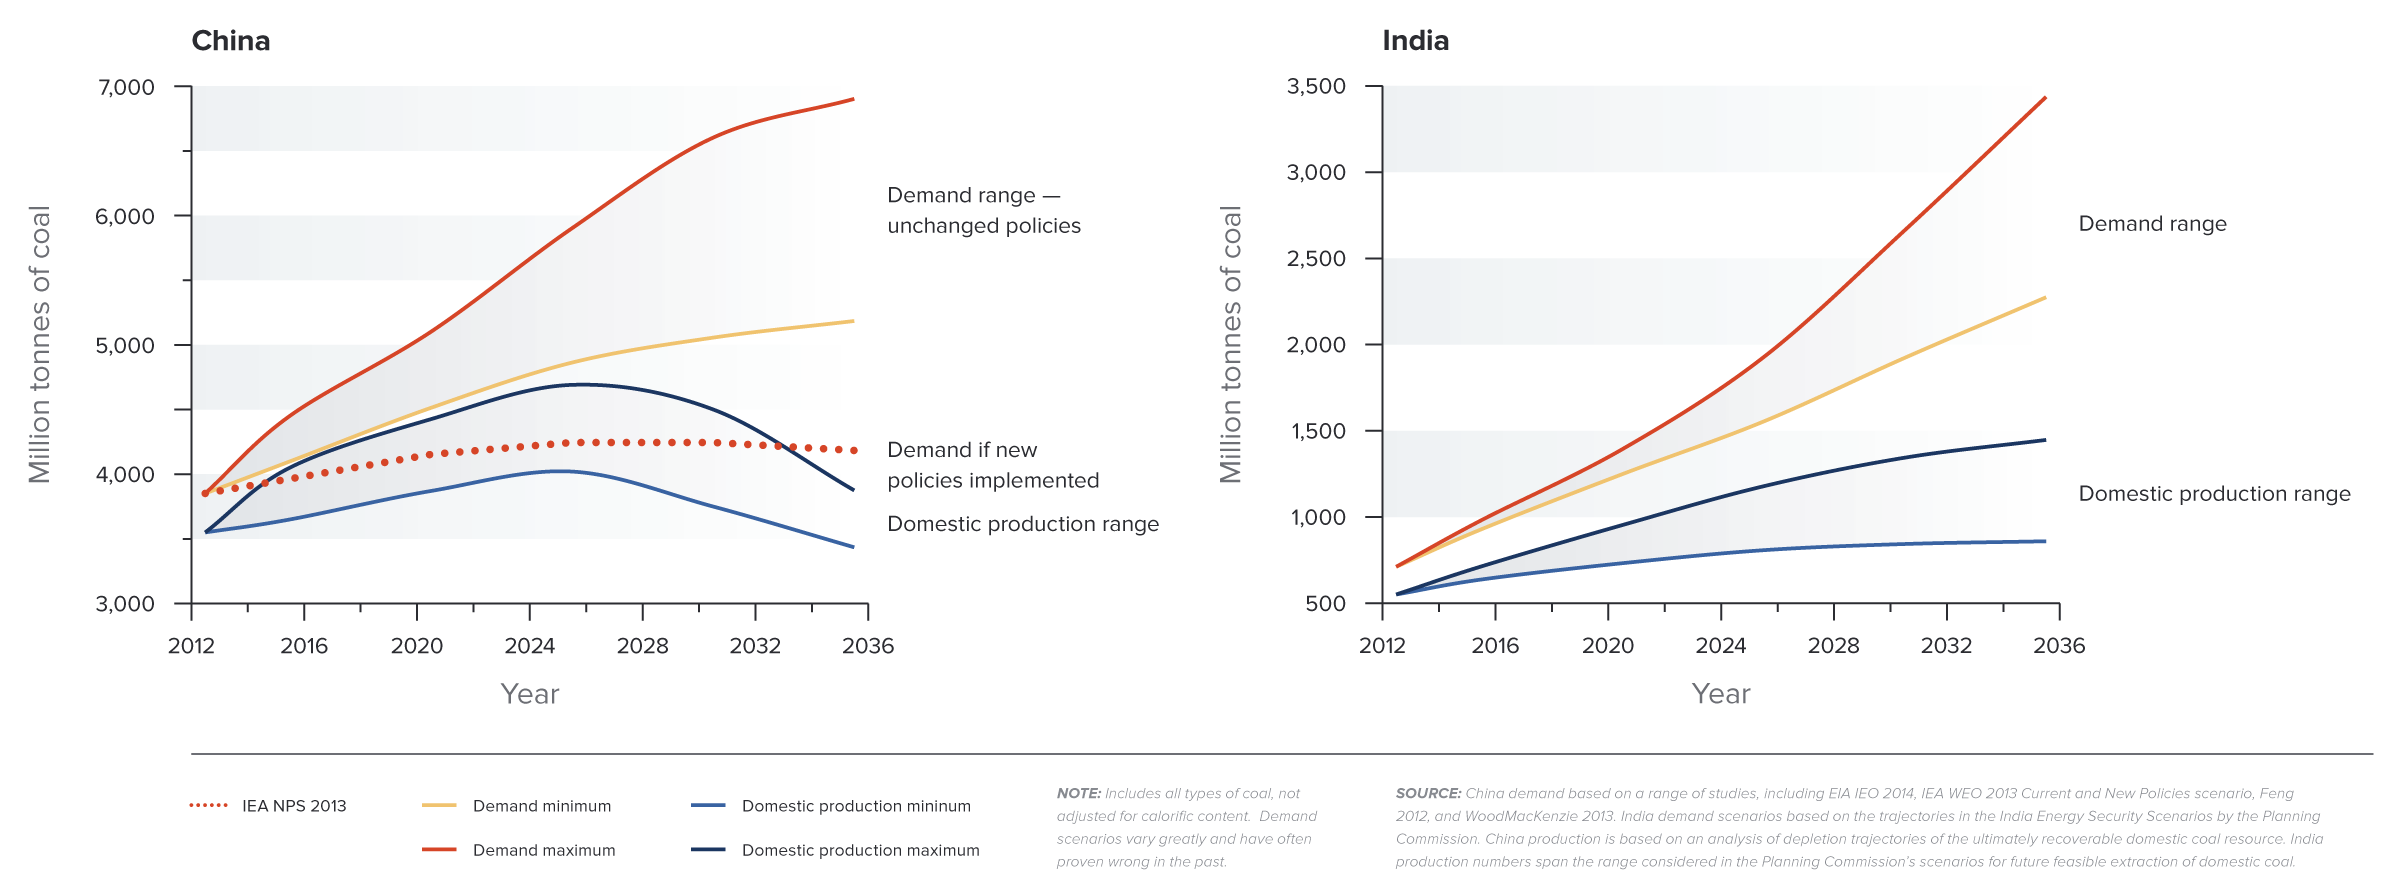
Note: Main ranges for demand scenarios do not assume policy changes to encourage steps towards lower coal use (China) or are based on a range of different energy efficiency developments for a given rate of economic growth (India). The broken line for China (IEA 2013, New Policies Scenario) illustrates a possible demand trajectory based on Chinese policies to curb coal demand growth. The figure includes all types of coal, not adjusted for calorific content.
Sources: China demand (non-broken lines) based on the range spanned by US Energy Information Administration, 2013; IEA, 2013, Current Policies scenario; Feng, 2012; and Wood MacKenzie, 2013. India demand scenarios are based on the trajectories in the India Energy Security Scenarios (IESS) in Planning Commission, 2013. China production is based on an analysis of depletion trajectories of the ultimately recoverable domestic coal resource. India production numbers span the range considered in the Planning Commission’s IESS for future feasible extraction of domestic coal. 140
The damage from air pollution has proven substantial and hard to address once coal-based infrastructure is built out; in China, mortality from air pollution is now valued at 10% of GDP. 141 In many countries, properly accounting for the cost of pollution erodes the cost advantage of coal. For example, coal-fired power has a financial advantage in much of Southeast Asia, at costs of US$60–70 per MWh. But properly accounting for air pollution can add a cost of US$40/MWh or more, enough to bridge or exceed the cost gap to alternatives. 142
Coal is also the most carbon-intensive of fossil fuels, accounting for 73% of power sector emissions but only 41% of generated electricity. 143 Reducing coal use is an essential feature of pathways to reduce CO2. For example, the IEA 450 scenario sees coal-fired power generation falling to 60% of 2011 levels by 2030, and total reductions in coal emissions of 11 Gt CO2. 144 Analysis carried out for the Commission suggests that as much as half of this reduction could be achieved at zero or very low net cost, once the changing cost of alternatives, and reduced health damages and other co-benefits are taken into account. 145
Instead, governments should require that new coal construction be preceded by a full assessment showing that other options are infeasible, and the benefits of coal outweigh the full costs.
Renewable energy sources have emerged with stunning and unexpected speed as large-scale, and increasingly economically viable, alternatives to fossil fuels, particularly in the power sector. 146 Over a quarter of the growth in electricity generation in 2006–2011 came from renewables. 147 Hydropower has long been a major energy source, but rapidly falling prices are also making wind and solar power increasingly cost-competitive with coal and gas in many markets. 148 In Brazil, for example, wind power was the cheapest source of new power at recent auctions, and South Africa has procured wind power at costs up to 30% below those of new coal-fired power. 149
Solar photovoltaic (PV) power remains costlier than wind, but now costs half as much as in 2010, 150 as module prices have fallen 80% since 2008. 151 The world’s largest, unsubsidised solar PV plant, 70 MW in Chile’s Atacama Desert, was contracted in 2013. 152 At least 53 solar PV plants over 50 MW were operating by early 2014, in at least 13 countries, and several planned projects are now considered competitive without subsidies. 153 Small-scale solar is also already competitive with retail electricity in many countries, and is rapidly becoming cheaper than other off-grid options such as diesel generators. 154 Biomass, geothermal and nuclear power are also proven technologies. Overall, a sea change in expectations has taken place. Even baseline scenarios now foresee wind and solar power contributing large shares of new power in the next two decades, 155 and zero-carbon sources overall can be a mainstay of meeting future energy needs.
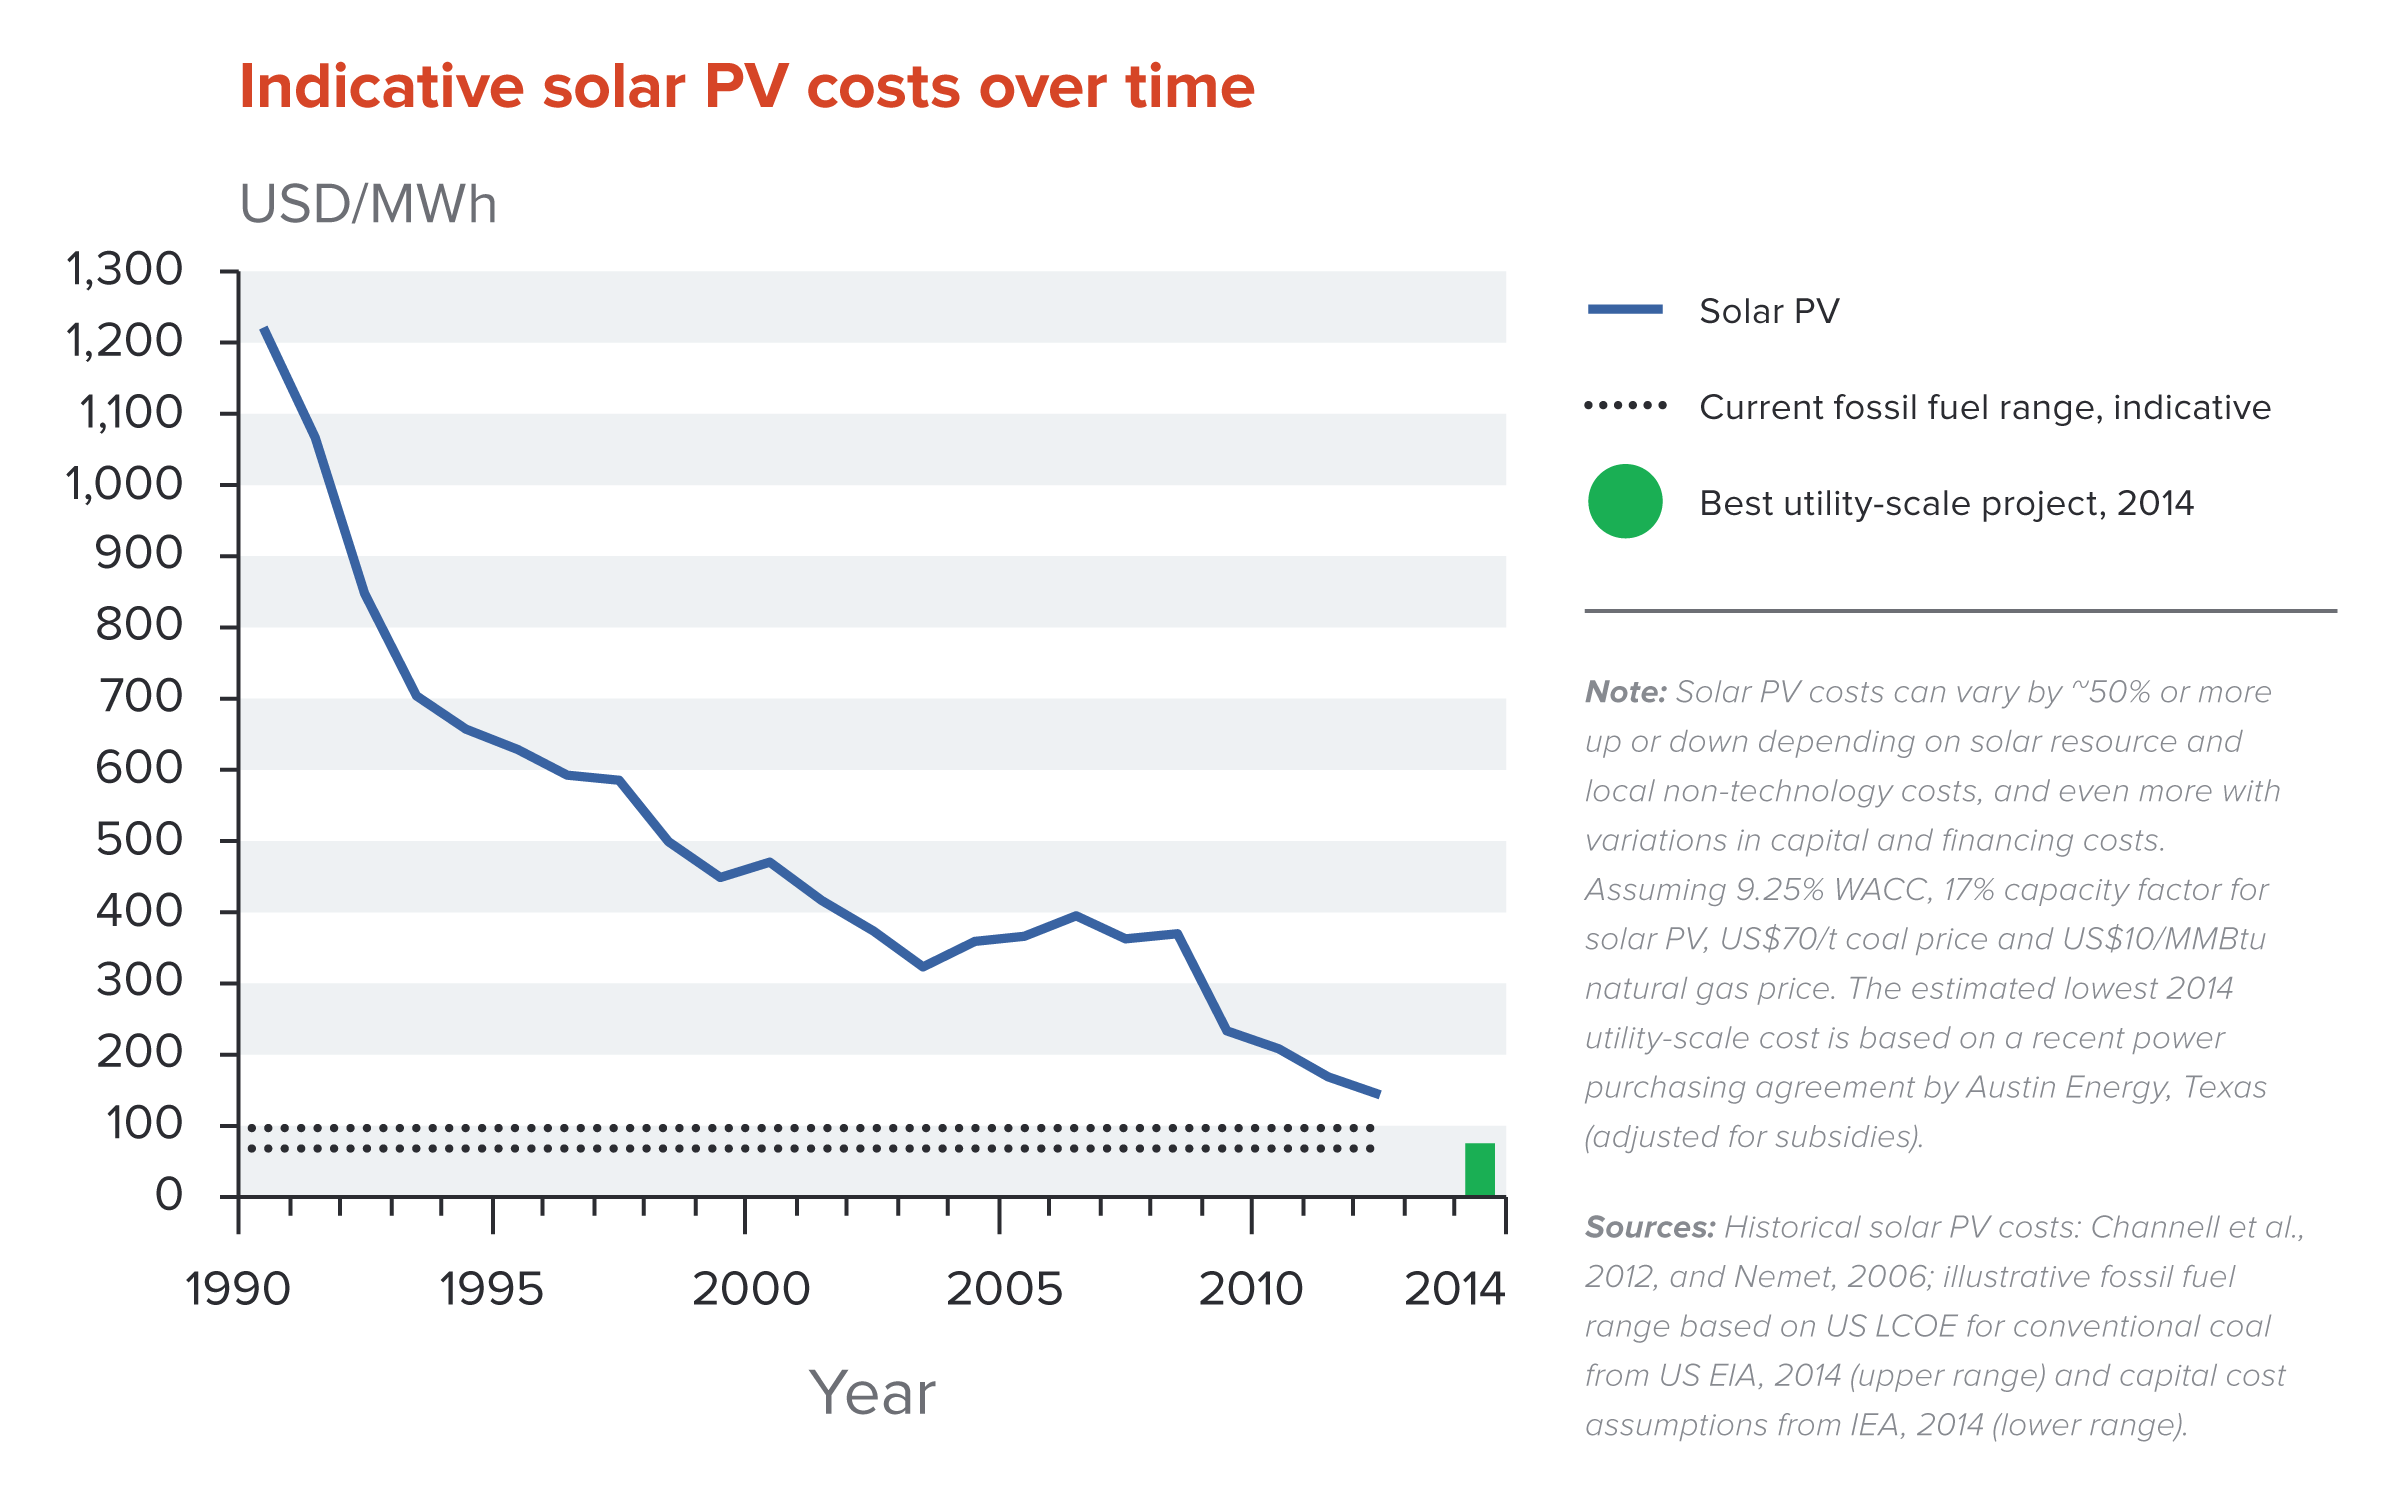
Note: Solar PV costs can vary by ~50% or more up or down, depending on solar resource and local non-technology costs, and even more with variations in capital and financing costs. Assuming 9.25% WACC, 17% capacity factor for solar PV, US$70/t coal price and US$10/MMBtu natural gas price. The estimated lowest 2014 utility-scale cost is based on a recent power purchasing agreement by Austin Energy, Texas (adjusted for subsidies).
Sources: Historical solar PV costs: Channell et al., 2012, and Nemet, 2006; illustrative fossil fuel range based on US LCOE for conventional coal from US EIA, 2014 (upper range) and capital cost assumptions from IEA, 2014 (lower range). 156
There is significant potential to go further. Costs are still falling, and virtually all countries have resources that they can exploit. But there also is strong inertia and specific challenges. Harnessing this potential will require active effort and support for these new ways of supplying power. Renewable energy can compete only where institutions and markets are set up to accommodate it. The benefits of energy security and lower pollution need to be accounted for. Markets and financing arrangements now set up for fossil fuels will need to be adapted. In addition, the variability of solar and wind power output leads to some additional costs of grid integration and the need to adjust electricity system planning as the share increases. Pioneer countries that are now increasing their share of variable renewables to high levels have a key role to play in developing the solutions that will enable others to reach high shares in decades to come.
Nonetheless, with the right mechanisms in place most countries can give renewables a central role in new supply for the next 15 years. Yet on current course there is a risk that the potential is not realised.
All should articulate and evaluate an energy strategy with significant contributions from renewable and other zero-carbon energy, and adapt electricity system planning, market and financing arrangements, and support systems to enable these options to fulfil their potential in meeting future power needs.
Natural gas also is changing its role. Outside a few countries dependent on coal, it already is a dominant source of new energy. 157 In the United States, cheap shale gas has swung the pendulum strongly away from coal, and there are potential reserves in many other countries. Gas has also been discussed as a potential “bridge” to lower-carbon energy systems, because it can quickly displace coal, reducing both CO2 and local air pollution. 158 In addition, gas can support power systems with higher shares of variable renewable energy.
However, the potential for gas as “bridge” fuel is not guaranteed. 159 Strong accompanying policies will be needed, such as attributing to coal its full social cost, regulating production to limit fugitive methane emissions, putting a price on carbon emissions, and supporting low-carbon technologies so their development and deployment are not slowed down.
Carbon capture and storage (CCS), meanwhile, offers the potential to reduce CO2 emissions while continuing to use some fossil fuels. Many scenarios to limit global warming to 2°C rely on some level of CCS deployment, and estimate that costs would be higher if this option were not available. 160
Yet although CCS is a proven technology in the upstream petroleum sector, in the power sector, it is still in the early stages, and investment is a fraction of what the IEA estimates is needed. 161 Scaling up CCS so it becomes a realistic option will require both a social license to operate and long-term, stable climate policy: support for demonstration projects, as well as mechanisms to create demand, underpin investment in infrastructure, and enable the development of new business models.
The greatest opportunity to benefit from modern energy is for the 1.3 billion people who have no access to electricity, most of them in Africa and Asia, and the 2.6 billion who lack modern cooking facilities. 162 Furthermore, in many urban and peri-urban areas in the developing world, large numbers of people have only partial or unreliable access to electricity.
Proven routes to electricity access through urbanisation and grid extension are now complemented by the potential for off-grid and mini-grid solutions. Falling costs, new business models, and technological innovations are making these increasingly cost-effective. In addition to finance and policy, more innovation and experimentation are needed, not least to ensure these solutions prove their ability to supply low-carbon electricity as demand grows beyond lighting and low-power appliances. There is also a need to accelerate the pace of providing access to better cooking facilities. 163
Another large opportunity involves improving in energy efficiency and productivity (the economic value created per unit of energy input), which effectively provides the world with an additional fuel. In developed countries, energy efficiency improvements have cut the effective demand for energy by 40% in the last four decades 164. No other source of energy has contributed as much.
Focusing on energy efficiency as the “first fuel” has large benefits in terms of balance of payments (from avoided fossil fuel imports), growth potential, local air pollution, greater levels of energy services, and lower carbon emissions. It can also be highly cost-effective compared to increasing the supply of energy. Even with “rebound” effects, efficiency thus is an essential contributor to meeting energy needs. Exploiting efficiency opportunities will be particularly important to emerging economies, as they rapidly grow their energy demand. India’s energy requirements in 2030, for example, are 40% greater in a scenario of low energy efficiency than in one with high energy efficiency. 165
On a global scale, the energy required to provide energy services in 2035 could vary by the amount of energy used today by the OECD, depending on whether a high or low efficiency path is struck. 166 And large untapped efficiency opportunities remain – across buildings, vehicles and industry. Yet energy efficiency is held back by a combination of ineffective energy pricing, policy distortions, lack of awareness, poorly aligned incentives within key markets such as housing, and low prioritisation of energy efficiency by many businesses.
These should include specific targets and sector-based opportunities, as well as policy measures addressing the barriers that prevent the development of energy-productive economic activity and energy-efficient end use.

The world is changing rapidly: the share of output from emerging markets and developing economies is rising sharply; the global population is growing and moving to rapidly expanding cities; energy systems are being built and rebuilt. At the same time, the risks of dangerous climate change are increasing.
There is a perception that there is a trade-off in the short- to medium term between economic growth and climate action, but this is due largely to a misconception (built into many model-based assessments) that economies are static, unchanging and perfectly efficient. Any reform or policy which forces an economy to deviate from this counterfactual incurs a trade-off or cost, so any climate policy is often found to impose large short- and medium-term costs.
In reality, however, there are a number of reform opportunities that can reduce market failures and rigidities that lead to the inefficient allocation of resources, hold back growth and generate excess greenhouse gas emissions. Indeed, once the multiple benefits of measures to reduce GHG emissions are taken into consideration, such as the potential health gains from better local air quality, many of the perceived net costs can be reduced or eliminated.
This chapter presents a framework designed to achieve “better growth” that increases quality of life across key dimensions – including incomes, better health, more liveable cities, resilience, poverty reduction and faster innovation – while also achieving a “better climate” (reducing GHGs). The framework starts from the recognition that economies are not static, but rather are dynamic and constantly changing. It has four main building blocks:
How the framework is applied will vary by country, depending on income levels and economic structures. For example, countries such as South Korea have used industrial policies to foster new and productive low-carbon industries. Vietnam used tax reforms, by adjusting tax rates on polluting goods and services, such as fuels and chemicals, to reflect their environmental damage. China has incorporated growth and low-carbon objectives into its five-year plans. The shape of its 13th plan (2016–2020) is likely to strengthen this transformation.
This includes decision-making tools and practices, such as economic and business models, policy and project assessment methods, performance indicators, risk analytics and reporting requirements, described in depth in our report. Below we introduce some key aspects of the framework that are developed in the chapter.
To manage change and realise growth opportunities, clear and credible policies are needed to align expectations, guide investors, stimulate innovation, and avoid locking in to carbon-intensive infrastructure and behaviours. Managing change also requires strong institutions that can set such clear and credible policies. Weaknesses in institutions and policy uncertainty raise the costs of change and slow the transition.
Policy reforms involve tackling a range of market failures, notably with respect to GHG emissions, which remain unpriced in many countries, but also in areas of local air pollution, congestion, energy efficiency and R&D. There are also multiple policy distortions which subsidise the wasteful use of resources, including energy, water and land. The results are bad for economic efficiency, bad for growth, bad for fiscal deficits and bad for the environment. Thus, tackling these market distortions should be a priority – though it will not be easy, as there are difficult political economy issues. With strong leadership and clear and credible policies, political barriers can be overcome.
A good place to start is a reassessment of the basis of fossil fuel subsidies – essentially negative carbon prices. The Organisation for Economic Co-operation and Development (OECD), for example, has estimated the value of support for fossil fuel production and consumption in its member countries at US$55–90 billion per year in 2005–2011, mostly in the form of tax breaks for consumption. 167 The International Energy Agency (IEA) has estimated fossil fuel consumption subsidies in emerging and developing countries at around US$540 billion in 2012. 168 The majority of these were for energy consumption in net fossil fuel-exporting countries (Figure 11). 169
These subsidies have many costs; governments can benefits from their removal, and there are more efficient ways of achieving the same social objectives.
These should include enhanced transparency and communication and targeted support to the poor and affected workers.
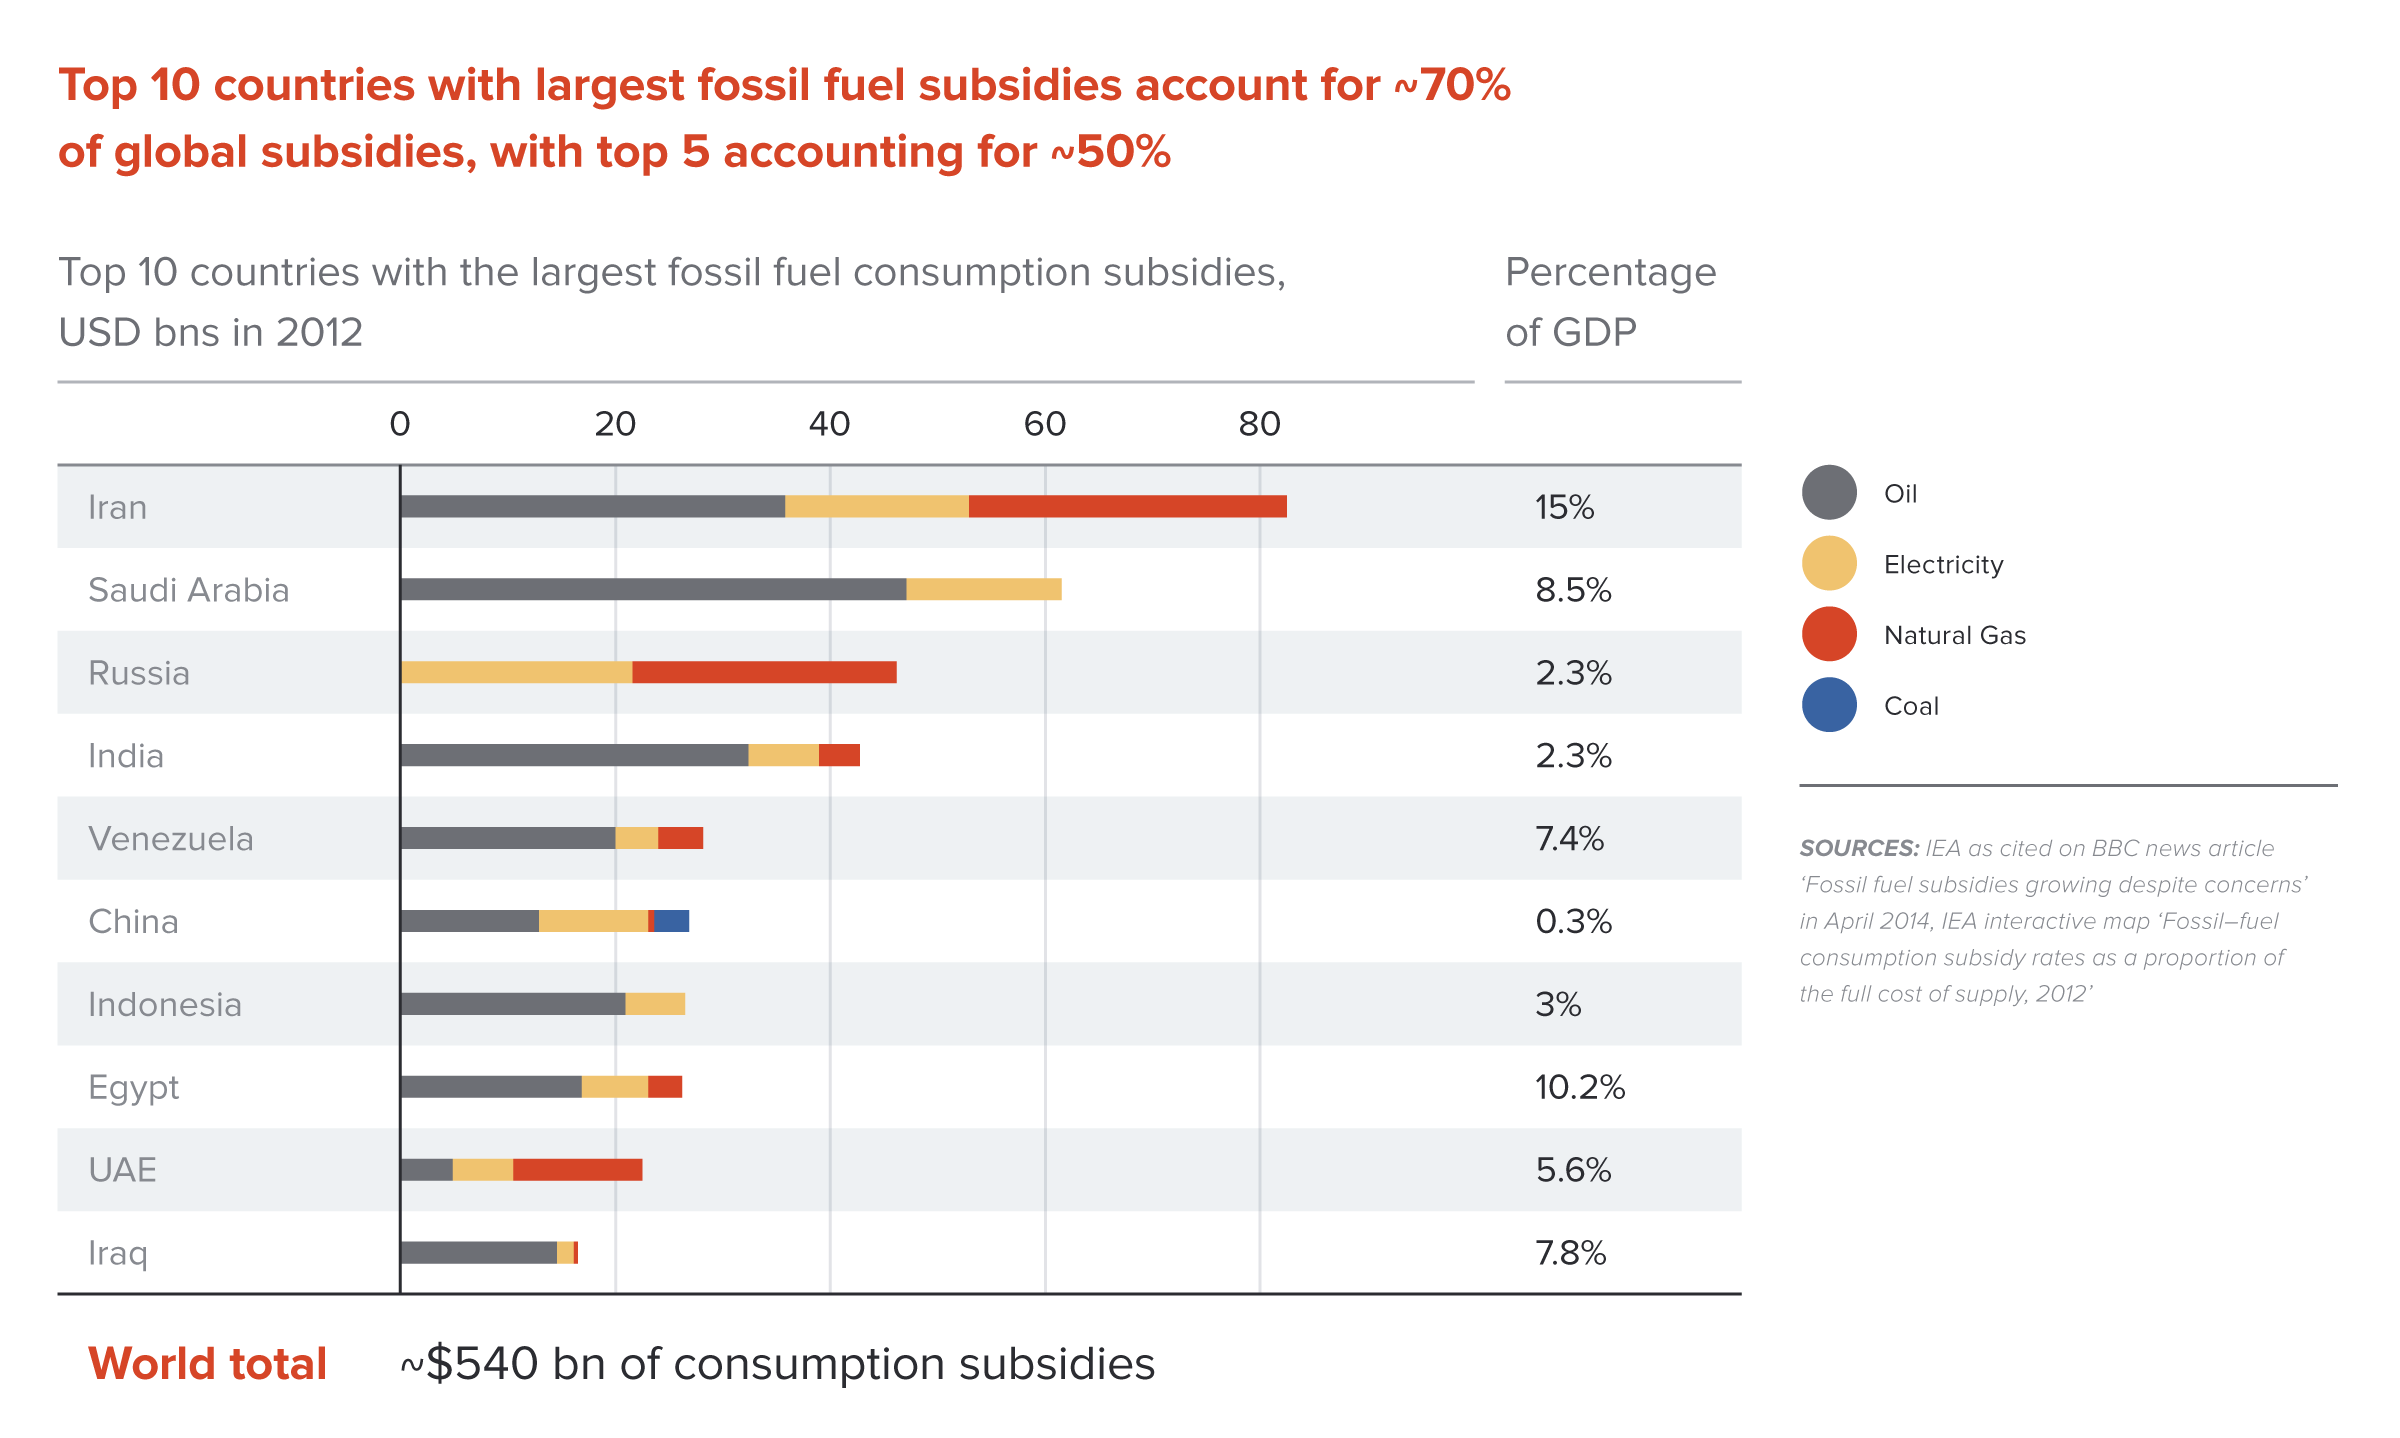
Source: IEA, 2013. 170
Carbon prices – typically imposed as taxes or through a cap-and-trade system – tackle the greenhouse gas market failure head on. They tax an “economic bad” and raise revenue for governments. With smart recycling of revenues they also have the benefit of being relatively non-distortionary in the short run and providing an effective signal to reallocate resources over the medium- to long-term. A share of the revenues should be prioritised to offset impacts on low-income households. A recent World Bank report shows that about 40 countries and over 20 sub-national jurisdictions now apply or have scheduled to apply carbon pricing through a carbon tax or emissions trading scheme (ETS). A further 26 countries or jurisdictions are considering carbon pricing. Together these schemes cover around 12% of global emissions. 171
Successful carbon pricing schemes have often started with a low carbon price, but with a clear and credible rising price path. This provides a clear policy signal, but allows time for industry and households to adapt and to make investments in technologies or changing practices that can reduce their GHG emissions.
Economic principles also tell us that other measures are needed, besides pricing reform. Many countries have successfully introduced energy or fuel efficiency performance standards in their transport, buildings and appliances industries, helping to overcome weak end-user responsiveness to prices. Existing fuel economy standards in the auto sector are expected to increase fleet efficiency by over 50% over the next decade. Governments and businesses are also getting smarter about behavioural nudges to shift end-user conduct, such as using peer-information systems to spur households to reduce wasteful energy consumption (e.g. by indicating how a household’s energy consumption compares to its neighbours’). We are also seeing a shift in regulatory incentives, especially in the electricity sector, as governments look to reward electricity suppliers that are able to help their customers become more energy-efficient.
But reform needs to go even further in terms of supporting greater economic flexibility, which is essential if countries are to make the transition to a low-carbon growth model in a cost-effective way. Better labour market, capital market, competition, educational and innovation polices can all contribute to this more flexible economic model and accelerate the shift of resources into high-productivity, low-carbon activities. Competitive markets in which prices properly reflect the full costs of production are vital to enable resources to flow to where they are most productive.
Better coordination of policy could transform efficiency and accelerate the pace of change. In May 2014, Ministers of Finance and Economy asked the OECD and the IEA to provide recommendations on how to align policies to achieve a low-carbon transition. Such work will be an important follow-up to the New Climate Economy report.
Better metrics and models are also needed to guide the low-carbon transition. It is often said that we cannot manage what we cannot measure, and we cannot assess the likely impacts of what we struggle to predict.
In practice, governments have found it difficult to implement the most cost-effective and efficient policies for growth and reducing climate risk, such carbon pricing. This difficulty is partly a result of political economy pressures, including powerful vested interests in a fossil fuel-based economy and concerns around competitiveness and around the potential for regressive impacts on households from these policies.
Given these constraints, many countries have adopted pragmatic “second-best” approaches where the alternative may be no policy at all. Governments may also find it prudent to take a step-by step approach, to discover the right set of policies and institutions to advance overall welfare.
The exact package of policies used in any country will need to reflect its specific circumstances and context. To ensure a continuing transition towards more optimal policy design, governments can legislate provisions to review the effectiveness and efficiency of policies.
Countries also need to recognise and tackle the social and economic costs of transition. The specific costs, trade-offs and benefits that affect particular groups need to be carefully analysed. Dedicated, transparent measures are likely to be needed to reduce the costs and trade-offs for workers and firms. This means not only implementing measures to reduce the impact on low-income households (as alluded to above), but also ensuring a just transition for workers whose livelihoods are affected by change.

Transitioning from a high-carbon to a low-carbon economy will require significant investment. Businesses, land owners, farmers and households will need to invest to improve efficiency; energy producers will need to switch to low-carbon generation. Governments will need to expand and enhance infrastructure productivity, and also seek to influence the direction of private finance through regulation, incentives, co-investment, risk-sharing instruments and other policy measures.
Much of the needed investment in low-carbon infrastructure can be handled through existing structures and mechanisms, with the help of effective policy, regulation and market signals. But for some investments – most notably a low-carbon transition in the power sector – creating efficient finance structures and attracting finance is more challenging and may require dedicated policy.
Even before accounting for climate action, the global economy will require substantial investments in infrastructure as the population and the middle class grow: an estimated US$89 trillion by 2030 across cities, land use and energy systems. 172 For a good chance of keeping global warming below 2°C, a large share of those investments will have to be reallocated. Improving the energy-efficiency of buildings, industry and transport, for example, could require an additional US$8.8 trillion of incremental investment, as analysis for the Commission shows. Deploying low-carbon technologies including renewables, nuclear and carbon capture and storage (CCS) could require another US$4.7 trillion. Yet a low-carbon scenario could also save money in other areas, such as US$5.7 trillion saved in fossil-fuelled power plants and along the fossil fuel supply chain, and up to US$3.4 trillion from building more compact, connected cities and reducing sprawl (see Figure 2).
Overall, the net incremental infrastructure investment needs from a low-carbon transition up to 2030 could be just US$4.1 trillion, if these investments are done well. 173 In this case, the infrastructure capital needed for a low-carbon transition would be only 5% higher than in a business-as-usual scenario, helping to limit future climate impacts and adaptation costs. Other studies have suggested even lower investment needs, given some of the potential synergies in fuel and infrastructure savings. 174
Between public and private sources, there is already sufficient capital available to finance a low-carbon transition. Many new industries and market structures are already emerging in both the developed and developing world. However, current industry and financial structures often allocate capital inefficiently, with risk, reward and geographic preferences that do not match well with an effective low-carbon energy transition. Accessing the necessary capital will require the right long-term policies, including carbon pricing and regulation. At present, however, the ambiguity, inconsistency and lack of predictability in policy settings creates high government-induced uncertainty, especially for long-lived assets, increasing risk and raising the cost of capital. Government-induced uncertainty is the enemy of jobs, investment and growth.
Predictable regulatory regimes are critical to providing the basis for stable revenue streams. These shape market expectations and can accelerate change and lower the costs of the transition to a low-carbon economy. Mixed and inconsistent signals can stifle investment and innovation and prevent us from realising vast potential benefits. Recent sudden changes in renewables policies in some European countries, for example, have been a major deterrent to investors and have significantly raised financing costs, to which renewable energy is particularly sensitive.
These will ensure that there is a robust business case to invest in a low-carbon economy. 175
Significant, near-term opportunities exist to reduce the costs of finance for low-carbon energy. In high-income countries, where there are deep pools of institutional capital in pension and insurance funds, new vehicles for low-carbon investment have been developed in recent years – including so-called “YieldCos”, municipal finance, crowd-sourcing and “green bonds”. When structured appropriately, these instruments could reduce the financing costs for low-carbon electricity by up to 20%. 176 They provide a way for institutional investors to invest directly in illiquid infrastructure assets and earn predictable inflation-hedged returns (well-matched against long-term liabilities) with greater liquidity.
These investment vehicles depend on the quality of the regulatory regime, the emergence of clear specifications and intermediaries to structure and refine the asset class, and the capacity of investors to treat them as part of diversified portfolios. With the right regulatory regime and financial intermediation in place, the intrinsic riskiness of low-carbon assets may prove to be lower than that of more volatile fossil fuel assets.
In many middle-income countries, using lower-cost public capital can significantly reduce financing costs for low-carbon energy. Financing costs are otherwise so high that they wipe out much of these countries’ cost advantage from lower labour and construction costs. (For example, financing in India adds 25% to the cost of solar power.)
China and Brazil already use variations on subsidised, low-cost financing for renewable energy. National development banks, national sovereign wealth funds and investments made from national budgets or state-owned enterprises (SOEs) under administrative direction fund substantial percentages of the world’s low-carbon investment, overwhelmingly in their own domestic markets. The China Development Bank, for instance, is the largest development bank in the world and has supplied over US$80 billion to renewable energy projects. 177 As of June 2012, 87% of wind projects and 68% of solar projects in China were built and owned by SOEs and their subsidiaries. 178 In Brazil, meanwhile, the national Brazilian Development Bank (BNDES) sets a separate long-term interest rate for loans to infrastructure projects. BNDES has committed about US$50 billion so far to low-carbon energy projects. 179 The lower financing costs sharply reduce the cost of renewable energy; in recent auctions in Brazil, for instance, the average price of wind power was only US$58/MWh. 180
In low-income countries, even those now exporting oil and other natural resources, mobilising capital for energy investments, whether low- or high-carbon, is still a major challenge. Given the lack of long-term domestic or international private capital for these classes of investment, multilateral banks and development finance institutions continue to play a central role in financing infrastructure. The extra capital costs of low-carbon energy present a challenge to multilateral banks, given many other demands on their balance sheet capacity. Fortunately, new initiatives, funding vehicles and programmes, special-purpose funds and institutions dedicated to providing energy in low-income countries are proliferating. These include securitised microfinance and small-scale mechanisms such as prepayment cards as used in mobile telephones.
This includes developing commercial investment vehicles that provide investors direct access to low-carbon infrastructure, such as YieldCos, direct finance by national, regional or municipal governments, and crowd-sourcing. In middle-income countries, national development or infrastructure banks can play a key role in lowering finance costs.
In low-income countries, multilateral and bilateral development bank assistance is a crucial source of finance for energy systems and infrastructure, and development cooperation should be enhanced to support country-led domestic policy and regulatory reforms aimed at fostering low-carbon energy growth.
From a broader financial perspective, the global economy could create value from the transition to low-carbon energy. Low-carbon infrastructure has significantly lower operating expenses and a longer expected lifespan than fossil fuel assets. 181 Low-carbon infrastructure also has the potential to achieve lower costs of capital, if financing and energy systems can be structured to take advantage of low-carbon energy’s inherently lower risks. Analysis for the Commission shows that in the power sector, these two factors together can offset the increased capital investment required to switch from coal to renewables (see Figure 12).
![]()
Source: CPI and NCE analysis based on data from IEA, 2012; IEA, 2014; Platts, and Rystad. 182
Taking into account the full financial picture, including operating savings,the full investment impact of a low-carbon transition in the electricity sector would be an estimated net financial benefit of up to US$1.8 trillion over the period 2015–2035. 183 This accounts for all investment impacts of a transition to a 2°C scenario from “business as usual”, including the decline in value of some fossil fuel assets, or “stranding”. 184
Clear policy signals can reduce stranded-asset risks by discouraging new investment in fossil fuels that would be at risk of stranding. Notably, the potential stranding of investment in the coal sector is less than for oil and gas, because coal produces less economic value per tonne of CO2 emitted, and there is comparatively less sunk investment in coal production, including coal-fired power plants. Over the next 20 years, reducing the use of coal can achieve 80% of the required energy-sector emissions reductions at only 12% of the total potential stranded-asset cost, supporting a focus on coal in climate policy.
Our work shows that three key actions are needed to reduce stranded-asset risks. The first is to send unambiguous signals, including through strong, predictable carbon pricing, about future economic direction, so those who invest in high-carbon assets understand that they are high-risk. Second, it is critical to limit further coal expansion in the power sector. Absent major investments in CCS, developed countries need to retire their existing coal plants as they age and not build any new plants. For developing countries, limited building of new coal-fired power generation may be needed, but only where cleaner alternatives are not economically viable. Third, governments should analyse the extent to which they are exposed to significant asset stranding risk, across coal, oil and gas value chains, and start to make necessary contingency and diversification plans.

Innovation is central to economic growth – long-term gains in productivity and new product development are determined by trends in innovation. Innovation also makes it possible to continue growing our economies in a world of finite resources. The importance of innovation is a recurring theme throughout this report; it is essential to transforming global energy systems, agriculture and cities. It also depends on and is shaped by factors discussed in the report, from investment strategies, to effective regulation of markets, to climate policy.
The Organisation for Economic Co-operation and Development (OECD) has projected that if current trends continue, as the global population grows from 7 billion in 2010 to more than 9 billion in 2050, per capita consumption will more than triple, from about US$6,600 to US$19,700 per year, and global GDP will nearly quadruple, requiring 80% more energy. 185 Sustaining growth at that scale will only be possible with radically new business models, products and means of production.
A number of fundamental innovation trends have great potential to drive strong growth towards a low-carbon, resource-efficient and resilient economy. In particular, materials science, digitisation and related business model innovations are already making an impact, reshaping entire industries, and creating opportunities for “leapfrogging” over less efficient, more polluting stages of development.
In the last 10 years, new and improved materials have driven down the cost and improved the performance of wind and solar energy (see Figure 13). In the US, over 30% of new electricity generation capacity added in 2010–2013 involved solar and wind power, up from less than 2% in 2000–2003. 186 Advances in materials have also facilitated large improvements in the efficiency of lighting and appliances, including the rapid emergence of light-emitting diodes (LEDs). They have enabled a broad array of technologies that improve the energy efficiency of the building envelope, 187 and they have enabled continual improvements in the fuel efficiency of vehicles. 188 Advances in materials are also critical to improving energy storage, and carbon capture, use and storage.
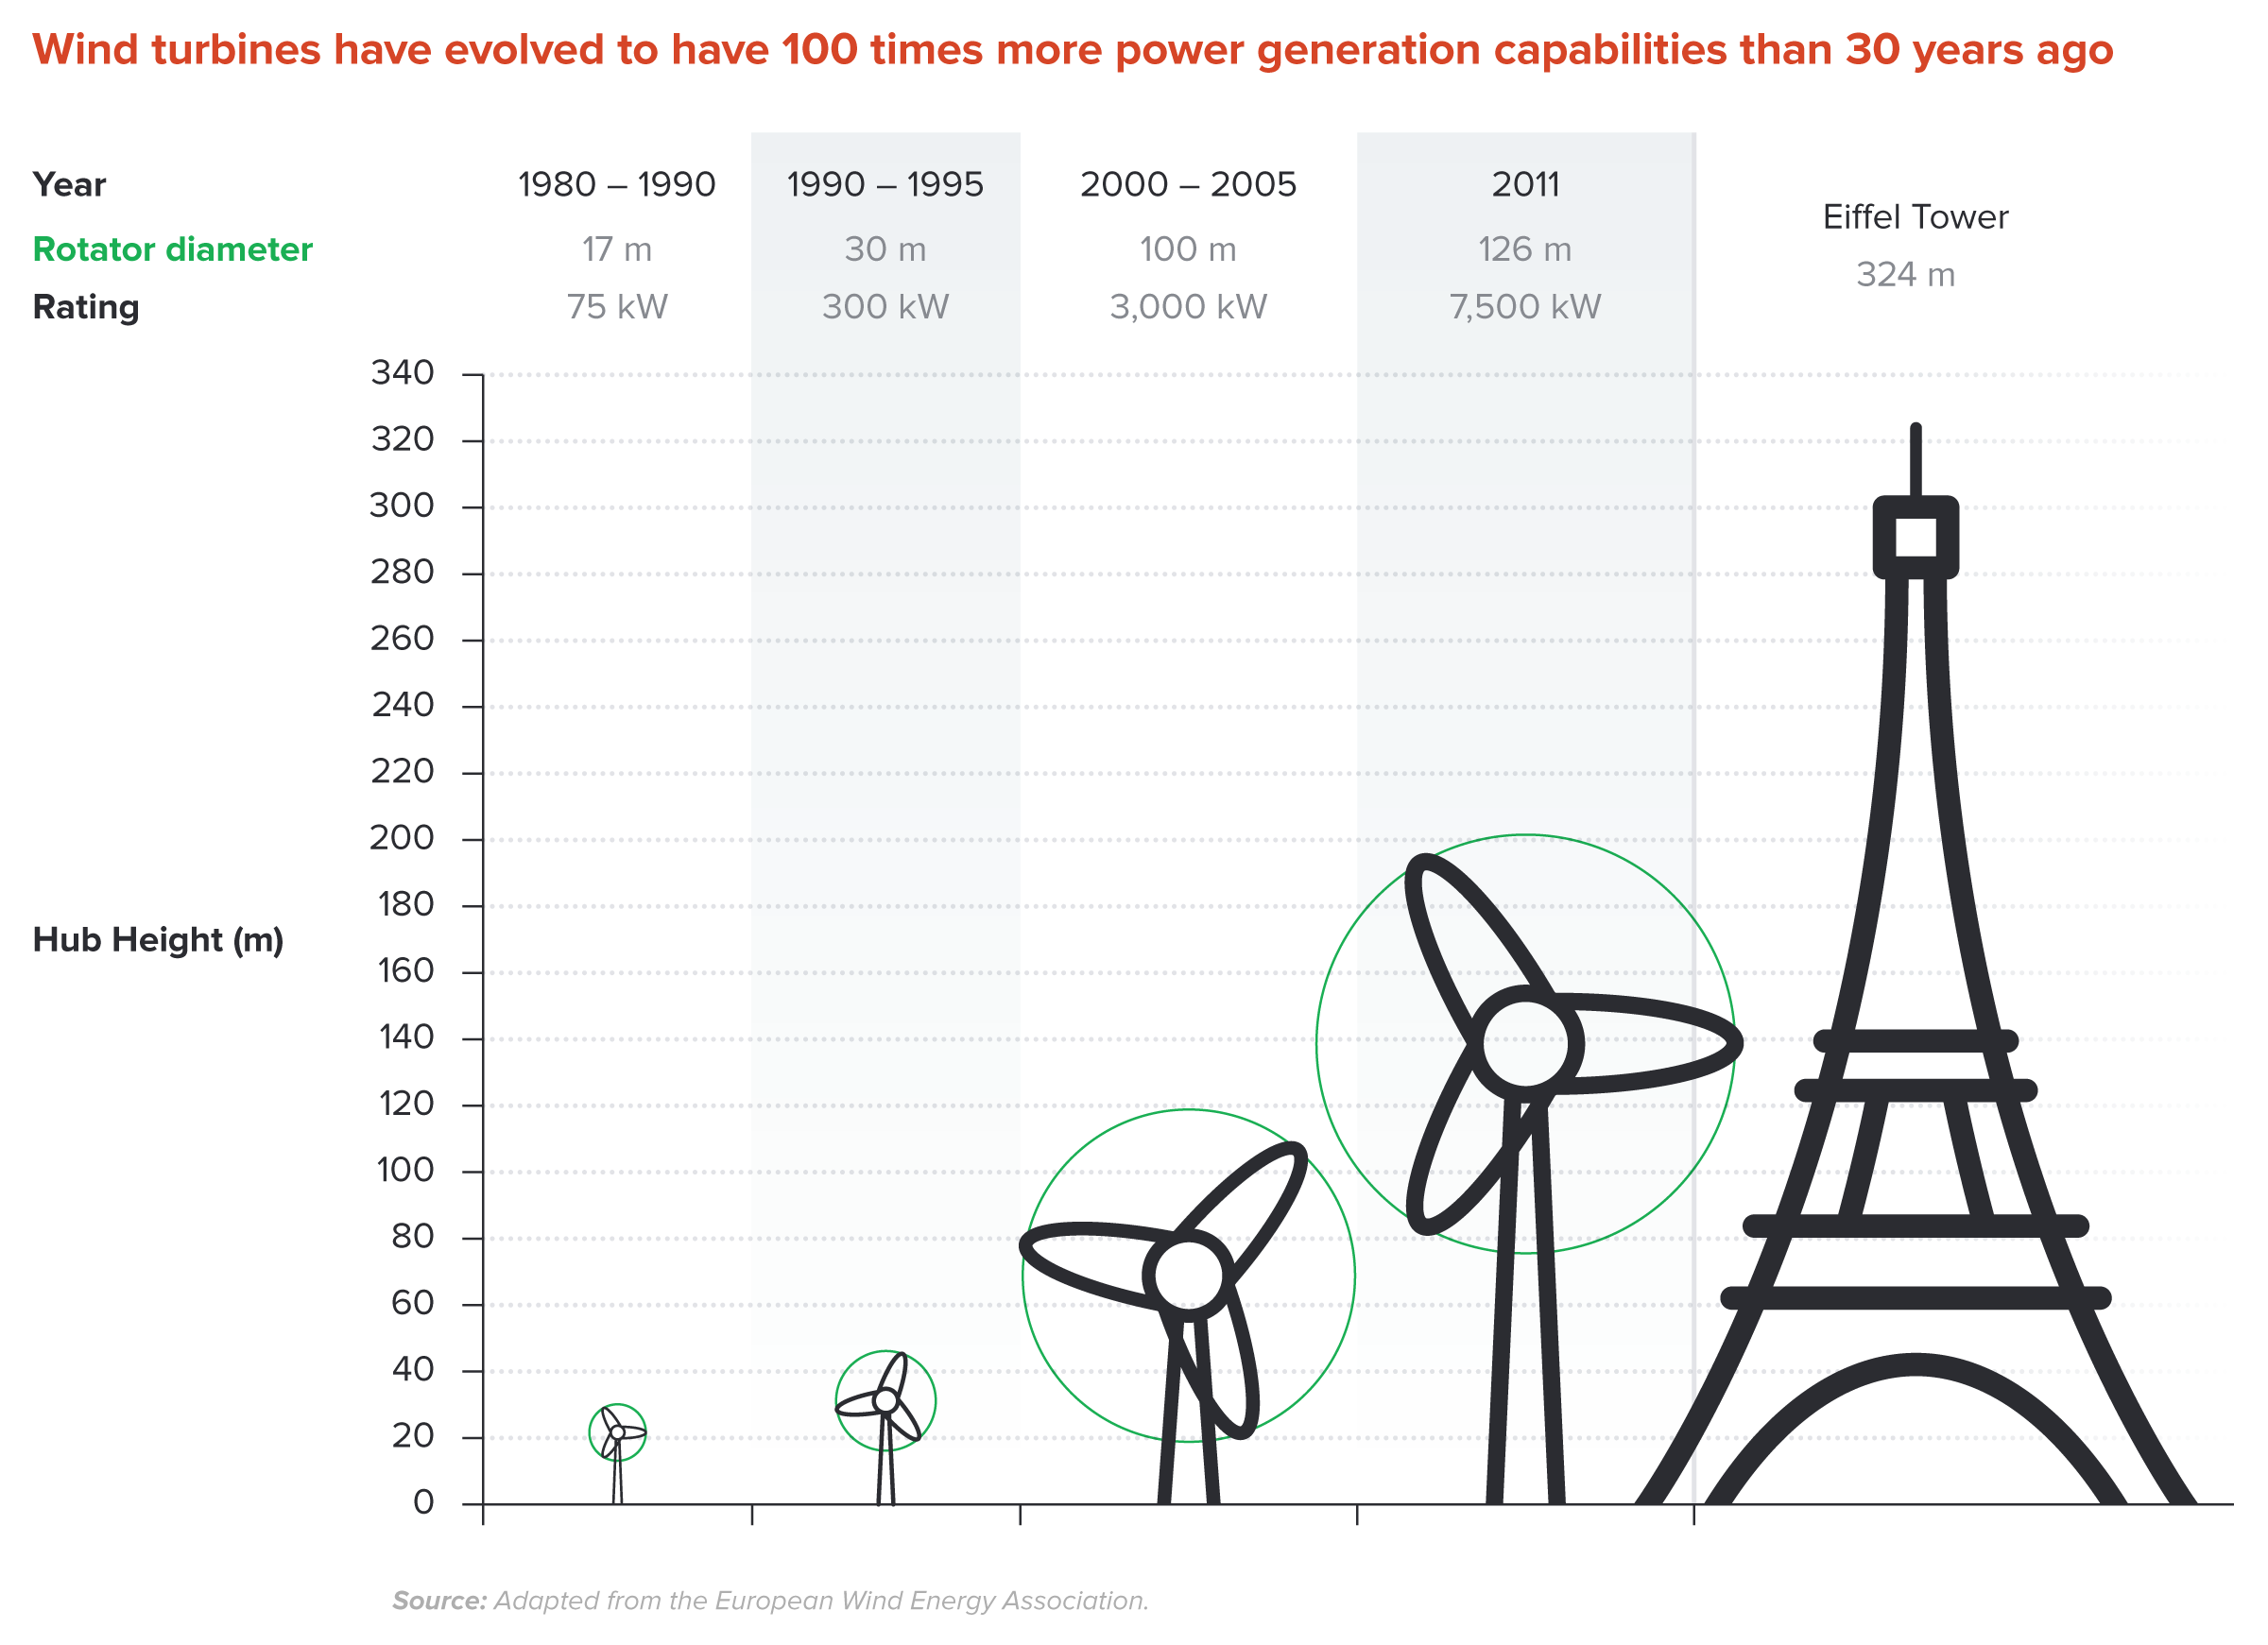 Source: Adapted from the European Wind Energy Association.
Digital technologies are also gaining traction through a range of new business models that reduce capital- and energy intensity across the economy. Cloud computing, for example, can increase efficiency and reduce companies’ overhead costs, energy use and related emissions. As Google’s LatLong project shows, the combination of digital satellite data and cloud computing can also help communities to better understand and prepare for the effects of climate change. 189
Digital technologies are changing behaviours at the individual level as well. They facilitate car- and ride-sharing schemes, guide riders through public transit, and help motorists avoid congested roads and find parking more quickly. In our homes, data-rich systems are increasingly able to control heating and lighting on a much more reliable basis. In some cases, these technologies have the potential to scale rapidly: China has already installed nearly 250 million smart meters. 190
In some cases, big opportunities are arising from the ability to combine technological advances through more open-innovation approaches and new business models. For example, Tesla Motors used supplier alliances, R&D alliances and Original Equipment Manufacturer (OEM) alliances to develop its product, and combined this with innovative business models for sales and marketing. As a result, its market capitalisation has increased from US$2 billion in 2010 to US$26 billion by 2013.
Two detailed examples illustrate how innovations can reshape an industry, and drive the transition to a new climate economy.
Supply chains typically move in one direction: material extraction, manufacture, use, and ultimately waste. The result of this linear model has been landfills full of useful products and components, representing wasted resources and lost potential revenues. Many companies are now looking to an alternative to the linear model, attempting to recycle, reuse and remanufacture wherever possible. Materials-related innovation is at the heart of the “circular economy”, and new materials technologies can facilitate the transition, with better conversion of used materials to new materials. Similarly, digital technology supports market creation, helping to match used goods with potential reuse or remanufacture markets.
A prominent example of the circular economy is Cat Reman, the remanufacturing division of the American machinery maker Caterpillar, which employs 8,000 workers in 68 plants across 15 countries. Materials make up almost two-thirds of Caterpillar’s costs. Through Cat Reman, the company disassembles products (called “core”) at the end of their lives, cleans all the parts, and salvages all that is reusable. This allows the company to boost profit margins, make “same-as-new”-condition products available to customers at a fraction of the cost of new ones, and in the process, reduce waste and greenhouse gas emissions.
The practice of restoring used products for resale is expanding rapidly. The United States is the largest remanufacturer in the world, with a domestic remanufacturing industry that grew by 15% between 2009 and 2011 to at least $43.0 billion, supporting 180,000 full-time US jobs. 191 Should economies worldwide successfully move to circular models, it has been estimated that more than US$1 trillion a year could be generated by 2025, with 100,000 new jobs created for the next five years, while also reducing GHG emissions. 192
However, capturing these benefits requires businesses to operate in new ways, with high cross-sector collaboration and alignment. A shift to a circular economic model will require new skills and systems, as well as regulatory change, from better labelling, to reduced consumption taxes on goods with refurbished components. Existing laws and regulations may stand in the way; for example, regulations on waste and end-of-life products can prohibit higher-value reuse. At the same time, it is crucial that recycling and remanufacturing efforts be underpinned by policies that ensure safe working practices and environmental protection.
Buildings consume 32% of global energy and produce 19% of energy-related GHG emissions, 193 while the construction industry produces 30–40% of global waste. 194 The sector is also expected to grow substantially in the next few decades. Yet the buildings value chain has huge potential for improving energy efficiency, reducing GHG impacts and creating economic value through various levers, including new products that reduce building energy use, modular construction and pre-assembly, improved building materials, process efficiency in cement and steel, circular business models, and sustainable architectural design.
Modular construction and pre-assembly strategies are already significantly reducing raw material use while lowering construction time. The Broad Group in China, for example, recently built a 30-storey, earthquake-resistant hotel in only 15 days through modular construction, and it has managed in some cases to use 96% recycled steel. 195 Pre-manufacturing the components in a factory allows builders to optimise resource use during construction, achieving efficiencies similar to a manufacturing facility.
Yet the construction sector is slow to change. This is due in part to the complexity of the building process. The energy intensity of a building depends on choices made by several different actors at different points in time, and the process is rife with misaligned incentives, as those who would benefit from savings are typically not the people making the choices. Finally, the common reliance in the sector on prescriptive standards and regulations, rather than performance or outcome-based ones, can slow innovation rather than encourage it. 196
The potential for innovations to accelerate the transition to a low-carbon economy is enormous, but there are real barriers. Theinvention process is constrained by the fact that the value of innovations is often difficult to protect, and becomes, to an extent, widely accessible. The diffusion of innovation, meanwhile, can be hindered by an array of market failures, including the failure to accurately price environmental damages; disincentives to be the first to adopt untested new technologies; and difficulties achieving network economies, which are crucial for innovations such as electric vehicles.
Barriers to entry, such as regulations favouring incumbent industry, also inhibit new technologies. Incumbency is powerful – the combination of capital invested (sunk costs), technology maturity, and outdated policy frameworks delay adoption of new technologies and business models. Measures to address and correct these market failures should be critical components of economic policy. The potential interventions fall into three broad categories:
Support for research and development (R&D), including publicly funded R&D and links between public R&D and the private sector, to ensure a strong link to market demand. The economist William Nordhaus found that R&D can have a social return on investment of 30–70%, compared with private returns of just 6–15%. 197 Yet energy-sector public research and development (R&D) is half what it was in late 1970s, in real terms, even amid growing concern about air pollution, energy security and climate change. The case for increased investment is bolstered by evidence that knowledge generated by clean tech has particularly high spillover benefits, comparable to those from robotics, IT and nanotechnologies. 198
Building market demand for the new technologies through pricing mechanisms, regulatory standards or direct procurement. The most common tools for creating demand for low-carbon innovations are pricing mechanisms (e.g. a carbon price or fossil fuel tax) and regulatory standards (e.g. energy efficiency standards) used to encourage widespread deployment. In some cases, encouraging demand requires removing poor regulations and other barriers, such as regulations that inhibit the shared use of capital-intensive goods, and those that deter entry into highly networked systems, such as the power distribution markets. There is a particular need for innovations to meet the demands of the world’s poorest populations; 199 for this, international support may be critical, to supplement national policies. 200 Public procurement can play a key role as well: innovation in semi-conductors in the US, for example, was driven by the prospect of large military procurement contracts.
Ensuring strong and fair competition through anti-trust and intellectual property regimes that protect the value of innovation and shape the diffusion of innovation. To attract significant private investment, low-carbon technologies will have to offer high rewards for success. This is only possible with a clear and strong intellectual property rights regime. 201 However, intellectual property rights can also present barriers to the diffusion of environmental technologies, by raising costs, limiting access, and placing countries with low institutional capacity at a disadvantage.
The role of intellectual property rights in limiting access to technologies by poorer countries is of particular concern. Patent pools may offer a potential solution: consortia created by owners of similar technologies pull together, and sometimes cross-license, common or complementary technologies. For the poorest countries, international support for technical capacity-building, and technology adaptation and adoption, will also be necessary. To address costs, a mechanism could be set up in conjunction with the Global Environment Facility or the new Green Climate Fund.
There is no single “right answer” for which policy instruments should be used to foster low-carbon innovation. In fact, a range of policy interventions are needed to address multiple market failures, to cultivate the broad innovation ecosystem, and to support innovation at different points in the process (e.g. across invention and diffusion). Effectively deploying such interventions requires a coherent innovation strategy and priorities, and stable funding. 202 Policies that monitor and evaluate results, set cost and performance targets, and dynamically respond to cost changes over time, have proven to be particularly effective. In some cases, governments may want to make targeted investment in low-carbon technologies that have a transformational potential, and could lead to large returns in the future. 203 Three examples are energy storage; carbon capture, use and storage, and advanced bioenergy – though there are many other potential “game-changers”.

Globalisation has been a major driver of both low- and high-carbon growth over the last 25 years. International trade and investment have enabled a huge expansion of global production, raising greenhouse gas emissions, but they have also helped advance the low-carbon economy. The increasingly global integration of supply chains for products such as solar and wind power components, for example, has helped dramatically reduce their costs. 204
The low-carbon economy is now a global phenomenon. International trade in environmental goods and services totals nearly US$1 trillion per year, or around 5% of all trade. 205 Trade in low-carbon and energy-efficient technologies alone is expected to reach US$2.2 trillion by 2020, a tripling of current levels. 206 Two-fifths of that market is expected to be in emerging and developing economies, 207 and the suppliers come from all over the world. In just the solar power sector, China and the US trade around US$6.5 billion worth of goods each year. 208
Yet there is much greater potential. This chapter focuses on the role of international cooperation in supporting the transformation of the global economy. Although most policy-making for low-carbon and climate-resilient growth will occur at the national and sub-national levels, five key forms of international cooperation can strengthen it. They are: a new international climate agreement, increased flows of international climate finance, improved trade agreements, various kinds of voluntary initiatives at the sectoral level, and changes to the rules and norms of the global economy.
A new legal agreement on climate change is essential to drive the investment and innovation in low-carbon, climate-resilient growth needed to keep global warming below 2°C. An agreement cannot force countries to tackle climate change; they act of their own volition. This is recognised in the current negotiations on a new agreement under the United Nations Framework Convention on Climate Change (UNFCCC), which rest on the foundation of “nationally determined contributions.” 209 But what an agreement can provide is a global framework of rules and commitments, which can make stronger action much likelier.
Countries need to feel confident that all are doing their fair share, so it is important that the new agreement be equitable. A majority of the greenhouse gases in the atmosphere today were emitted by developed economies. 210 Yet developing countries’ emissions now exceed those of high-income countries, driven primarily by fast-growing upper-middle-income economies, and their share is increasing. 211 Slowing emissions in developing countries is thus essential to avoiding dangerous climate change. The question is how to do this fairly, as these countries still have significant populations living in poverty, and they rightfully wish to continue developing their economies. Most also have much lower per capita emissions than developed economies. 212
What this means is that developed countries will have to make earlier and deeper absolute cuts to their own emissions, on a path to near-complete decarbonisation of their economies by mid-century. They will need to provide strong examples of how good policy can drive economic growth and climate risk reduction together; support the development and dissemination of new technologies; share know-how, including in collaborative ventures; strengthen funding sources and financial institutions to bring down the cost of capital; and provide strong climate finance to developing countries, for adaptation, mitigation and capacity-building.
By ensuring that all major economies put in place ambitious national targets, policies and laws within the same time frame, a new legal agreement will expand the scale of markets for low-carbon goods and services, and increase confidence that they will be sustained. It thus has the potential to act as a powerful macroeconomic policy instrument, sending clear signals to businesses and investors about the future low-carbon direction of the global economy.
The inclusion in the agreement of several core features would strengthen this economic impact:
Global flows of finance directed at low-carbon and climate-resilient investments in 2012 are estimated at US$359 billion. 213 Around a quarter (US$84 billion) of these climate flows were international, flowing across national boundaries. Of these, an estimated US$39–62 billion (46–73%) was directed at developing (non-OECD) countries from sources in developed (OECD) countries; 80–90% of this “North-South” financing came from public sources. 214
The developed countries will need to set out a pathway to show how they will achieve their agreed goal of mobilising US$100 billion per year in public- and private-sector finance by 2020.
Development finance institutions (DFIs), including multilateral development banks, national development banks, and bilateral and regional financial institutions, play a key role, disbursing about a third (US$121 billion) of climate finance in 2012. 215
Particular efforts need to be made to devise and use public finance and policy instruments to mitigate the risks faced by private investors, in order to leverage greater flows of private capital. Direct public finance, in the form of grants and concessional loans, continues to be important for adaptation and mitigation, including performance-related funding to prevent deforestation and forest degradation, and to support increased deployment of renewable energy. 216
Tariffs on low-carbon and environmental goods raise their costs and slow down their diffusion. Proposals to eliminate such tariffs have been made in the World Trade Organization (WTO) by countries accounting for 86% of global trade in these goods. 217 Yet at the same time, some of the same countries have become embroiled in serious trade disputes over specific low-carbon products in which there is particularly fierce competition. It is estimated that roughly 14% of WTO disputes since 2010 relate at least in part to renewable energy. 218 Many concern renewable energy subsidies and “local content” requirements which countries and states have used to support domestic industrial sectors; there are also several disputes over the pricing of low-carbon exports such as solar panels, which have led to increases in import duties. These disputes have raised prices, damaging the deployment of renewable energy sources.
At the same time, new regional trade agreements, such as those between the US and Europe and in the Asia-Pacific region, offer the potential to support low-carbon growth through new common standards, and the liberalisation of trade in sectors such as construction and urban planning where innovation can support the move to lower-carbon growth.
International cooperative initiatives – among groups of governments, cities, businesses and/or civil society organisations – are playing an increasingly high-profile role in promoting and supporting climate action in specific fields and sectors. Examples include the coalitions of cities undertaking climate action in the C40 Climate Leadership Group and ICLEI (Local Governments for Sustainability); the en.lighten initiative to phase out inefficient lighting, and the Partnership for Clean Fuels and Vehicles.
One notable development has been the emergence of business-led initiatives in sectors of the global economy where a large share of products are internationally traded, making it particularly difficult to manage the related GHG emissions. Examples in the consumer goods sector include the Global Protocol on Packaging Sustainability, and the Tropical Forest Alliance 2020 (TFA 2020). The TFA 2020 is a partnership of businesses, governments and non-governmental organisations committed to reducing deforestation driven by production of palm oil, soy, beef, and paper and pulp. In the case of palm oil, companies participating in the initiative have 15% of the total consumer market by volume, and well over 50% of the global trade in the commodity, which it is believed may make it possible to tip the entire global market towards sustainable palm oil.
One important initiative, the Climate and Clean Air Coalition to Reduce Short Lived Climate Pollutants (CCAC), is already stimulating reductions inmethane and hydrofluorocarbons (HFCs).
Establishing a long-term transition to a lower-carbon model of growth and development will also require a more systemic shift. All major economic actors – national governments, sub-national and city authorities, private- and public-sector companies and financial institutions – will need to integrate climate risk management into their core economic and business strategies. Each can do this for itself – but many more will do so if it is required by the rules and norms under which they operate. In a global economy, such rules and norms are increasingly determined at an international level.
Business reporting provides an important example. In recent years, more than 4,000 global companies have been reporting their GHG emissions at the behest of their major investors. 220 But these reports are not part of these businesses’ mainstream financial reports, and are not treated in the same way, either by the companies or by their shareholders. Few companies report systematically on the climate risks they face: the extent to which business assets, activities and future profits are made vulnerable by climate change and climate change policy. These need to be understood as an increasingly significant additional risk factor facing most major businesses, requiring specific actions to limit exposure and strengthen resilience.
This will motivate company boards to pay closer attention to these issues and to give higher priority to their management.
The same applies to investors, whose asset portfolios are also subject to climate risk, including the risks of devaluation or “stranding” arising from changes in climate policy and fossil fuel prices. In the last few years a number of investors have begun to recognise this and conduct more systematic and integrated assessments of their portfolios. 221
The management of climate risk and the transition to low-carbon and climate-resilient development and growth paths should also now become standard issues for international economic organisations and forums concerned with managing the global economy.
Economic growth and climate risk are intertwined; institutions and forums charged with fostering economic cooperation should be engaging deeply with the challenges and opportunities discussed in this report.
We live in a moment of great opportunity. Subscribe to the New Climate Economy Newsletter to get up to date information on how we can build a better economy and a better climate together.
We never share your information or use it to spam you.
Estimates based on population and poverty data (defined as living under US$2 per day, adjusted for purchasing power parity) for low- and middle-income countries in: The World Bank, 2014. World Development Indicators 2014. LINK
The number of people living under US$2 in low- and middle-income countries in 1999 was 2.9 billion. From 1990 to 1999, the absolute number of people in poverty increased by 87 million. See also: World Bank, 2014. Poverty Overview. LINK [Last updated 7 April 2014.]↩
This period encompasses what many economic decision-makers would describe as the short (0–5 years) and medium (5–15 year) terms. These time frames have been used in this report. The importance of the next 15 years for growth and climate change are discussed later.↩
Low-income countries’ growth, while substantial, has lagged that of middle-income countries. In 1990–2012, low-income countries’ GDP grew by 156%, while middle-income countries’ grew by 215%. Low-income countries’ share of the global economy only grew from 1.1% to 1.4% in 1990–2012, while middle-income countries’ share rose from 26.8% to 41.9%. See: The World Bank, 2014, World Development Indicators 2014. Data cited are for GDP (constant 2005 international $ PPP), available in the 11 April 2014 release of the WDI (but not on the web).↩
Agénor, P. R., Canuto, O. and Jelenic, M., 2012. Avoiding Middle-Income Growth Traps. Economic Premise, No. 98. The World Bank, Washington, DC. LINK↩
World Health Organization (WHO), 2014. Burden of Disease from Ambient Air Pollution for 2012. Geneva. LINK↩
International Monetary Fund (IMF), 2014. World Economic Outlook 2014: Recovery Strengthens, Remains Uneven. Washington, DC. LINK↩
IPCC, 2014. Summary for Policymakers. In Climate Change 2014: Mitigation of Climate Change. Contribution of Working Group III to the Fifth Assessment Report of the Intergovernmental Panel on Climate Change. O. Edenhofer, R. Pichs-Madruga, Y. Sokona, E. Farahani, S. Kadner, et al. (eds.). Cambridge University Press, Cambridge, UK, and New York. LINK↩
IPCC, 2013. Summary for Policymakers. In Climate Change 2013: The Physical Science Basis. Contribution of Working Group I to the Fifth Assessment Report of the Intergovernmental Panel on Climate Change. T.F. Stocker, D. Qin, G.-K. Plattner, M.M.B. Tignor, S.K. Allen, et al. (eds.). Cambridge University Press, Cambridge, UK, and New York. LINK
Summary for Policymakers. In Climate Change 2014: Mitigation of Climate Change. Contribution of Working Group III to the Fifth Assessment Report of the Intergovernmental Panel on Climate Change. O. Edenhofer, R. Pichs-Madruga, Y. Sokona, E. Farahani, S. Kadner, et al. (eds.). Cambridge University Press, Cambridge, UK, and New York. LINK↩
The IPCC estimates that the global average temperature will likely be 0.3–0.7°C higher in 2016–2035 relative to 1986–2005. See: IPCC, 2013. Summary for Policymakers (IPCC AR5, Working Group I).↩
IPCC, 2014. Summary for Policymakers. In Climate Change 2014: Impacts, Adaptation, and Vulnerability. Part A: Global and Sectoral Aspects. Contribution of Working Group II to the Fifth Assessment Report of the Intergovernmental Panel on Climate Change. C.B. Field, V.R. Barros, D.J. Dokken, K.J. Mach, M.D. Mastandrea, et al. (eds.). Cambridge University Press, Cambridge, UK, and New York. LINK↩
IPCC, 2014. Summary for Policymakers (IPCC AR5, Working Group II).↩
See: Melillo, J. M., Richmond, T. C. and Yohe, G. W., eds., 2014. Climate Change Impacts in the United States: The Third National Climate Assessment. US Global Change Research Program. LINK
Also: Gordon, K., 2014. Risky Business: The Economic Risks of Climate Change in the United States. The Risky Business Project. LINK↩
Of four representative concentration pathways analysed by the IPCC, only RCP 2.6, which requires global emissions to peak no later than 2020 and become net negative by 2090, is associated with a 66% or better chance of keeping warming below 2°C. See IPCC, 2013, Summary for Policymakers (IPCC AR5, Working Group I), and: van Vuuren, D.P., Edmonds, J., Kainuma, M., Riahi, K., Thomson, A., et al., 2011. The representative concentration pathways: an overview. Climatic Change, 109(1-2). 5–31. DOI:10.1007/s10584-011-0148-z. (See Figure 6.)↩
IPCC, 2014. Summary for Policymakers (IPCC AR5, Working Group III).↩
Applying the GDP growth projections of the Organisation for Economic Co-operation and Development (OECD) – 3.4% to 2018 and 3.3% for the remaining years – results in 69% cumulative growth. See: OECD, 2012. Medium and Long-Term Scenarios for Global Growth and Imbalances. OECD Economic Outlook, Volume 2012, Issue 1. Paris. LINK
A lower 2.5% annual growth rate would result in the economy being 48% bigger in 2030 than in 2014.↩
Climate Policy Initiative analysis for the New Climate Economy project, based on data from:
International Energy Agency (IEA), 2012. Energy Technology Perspectives: How to Secure a Clean Energy Future. Paris. LINK
Organisation for Economic Co-operation and Development (OECD), 2012. Strategic Transport Infrastructure Needs to 2030. Paris. LINK
Organisation for Economic Co-operation and Development (OECD), 2006. Infrastructure to 2030. Paris. LINK↩
See, e.g.: The World Bank, 2012. Inclusive Green Growth: The Pathway to Sustainable Development. Washington, DC. LINK
United Nations Environment Programme (UNEP), 2011. Towards a Green Economy: Pathways to Sustainable Development and Poverty Eradication. Nairobi, Kenya. LINK
Also see extensive work on green growth by the Organisation for Economic Co-operation and Development (OECD): LINK and by the World Economic Forum: LINK
The Green Growth Knowledge Platform, established jointly in January 2012 by the Global Green Growth Institute, the OECD, UNEP and the World Bank, lists a rich and diverse collection: LINK
The Nordic Council of Ministers has an extensive green growth library as well, and a magazine, Green Growth the Nordic Way; all are available at: LINK↩
The estimate is for low-carbon electricity in particular. See: Climate Policy Initiative (CPI), 2014. Roadmap to a Low Carbon Electricity System in the U.S. and Europe. San Francisco, CA, US. LINK↩
See: McCrone, A., Usher, E., Sonntag-O’Brien, V., Moslener, U. and Grüning, C., eds., 2014. Global Trends in Renewable Energy Investment 2014. Frankfurt School-UNEP Collaborating Centre for Climate & Sustainable Energy Finance, United Nations Environment Programme, and Bloomberg New Energy Finance. LINK↩
United Nations (UN), 2014. World Urbanization Prospects, the 2014 revision. UN Department of Economic and Social Affairs, Population Division. LINKThe urban population in 2014 is estimated at 3.9 billion; in 2030 it is projected to be 5.1 billion. For detailed data, see: LINK↩
Seto, K.C. and Dhakal, S., 2014. Chapter 12: Human Settlements, Infrastructure, and Spatial Planning. In Climate Change 2014: Mitigation of Climate Change. Contribution of Working Group III to the Fifth Assessment Report of the Intergovernmental Panel on Climate Change. O. Edenhofer, R. Pichs-Madruga, Y. Sokona, E. Farahani, S. Kadner, et al. (eds.). Cambridge University Press, Cambridge, UK, and New York. LINK↩
The Intergovernmental Panel on Climate Change (IPCC) estimates that in 2010, urban areas accounted for 67–76% of global energy use and 71–76% of global CO2 emissions from final energy use. See: Seto andDhakal, 2014. Chapter 12: Human Settlements, Infrastructure, and Spatial Planning.↩
IPCC, 2014. Summary for Policymakers. In Climate Change 2014: Mitigation of Climate Change. Contribution of Working Group III to the Fifth Assessment Report of the Intergovernmental Panel on Climate Change. O. Edenhofer, R. Pichs-Madruga, Y. Sokona, E. Farahani, S. Kadner, et al. (eds.). Cambridge University Press, Cambridge, UK, and New York. LINKThe IPCC reports net total anthropogenic GHG emissions from agriculture, forestry and other land use (AFOLU) in 2010 as 10–12 Gt CO2e, or 24% of all GHG emissions in 2010. The AFOLU chapter further specifies that GHG emissions from agriculture in 2000–2009 were 5.0–5.8 Gt CO2e per year. See: Smith, P. and Bustamante, M., 2014. Chapter 11: Agriculture, Forestry and Other Land Use (AFOLU). In Climate Change 2014: Mitigation of Climate Change. Contribution of Working Group III to the Fifth Assessment Report of the Intergovernmental Panel on Climate Change. O. Edenhofer, R. Pichs-Madruga, Y. Sokona, E. Farahani, S. Kadner, et al. (eds.). Cambridge University Press, Cambridge, UK, and New York. LINK↩
Total calories produced must increase by 70% from 2006 levels, per: Searchinger, T., Hanson, C., Ranganathan, J., Lipinski, B., Waite, R., Winterbottom, R., Dinshaw, A. and Heimlich, R., 2013. Creating a Sustainable Food Future: A Menu of Solutions to Sustainably Feed More than 9 Billion People by 2050. World Resources Report 2013-14: Interim Findings. World Resources Institute, the World Bank, United Nations Environment Programme (UNEP), United Nations Development Programme (UNDP), Washington, DC. LINK↩
A further 8% of agricultural land is moderately degraded, and the amount is increasing. See: Food and Agriculture Organization of the United Nations (FAO), 2011. The State of the World’s Land and Water Resources for Food and Agriculture (SOLAW) – Managing Systems at Risk. Rome. LINKSee also work by partners of the Economics of Land Degradation: A Global Initiative for Sustainable Land Management, launched in 2013: LINK↩
This figure is the gross amount of forest converted. When adding in reported reforestation and afforestation, the net figure is 5.2 million ha. See: Food and Agriculture Organization of the United Nations (FAO), 2010. Global Forest Resources Assessment 2010. Rome. LINK↩
For energy-related emissions outside direct industry emissions, see all sectors except AFOLU and waste in Figure TS.3a in: IPCC, 2014. Technical Summary. In Climate Change 2014: Mitigation of Climate Change. Contribution of Working Group III to the Fifth Assessment Report of the Intergovernmental Panel on Climate Change. O. Edenhofer, R. Pichs-Madruga, Y. Sokona, E. Farahani, S. Kadner, et al. (eds.). Cambridge University Press, Cambridge, UK, and New York. LINKFor direct energy-related emissions in industry, see Table 10.2 of Fischedick, M. and Roy, J., 2014. Chapter 10: Industry. In Climate Change 2014: Mitigation of Climate Change. Contribution of Working Group III to the Fifth Assessment Report of the Intergovernmental Panel on Climate Change. O. Edenhofer, R. Pichs-Madruga, Y. Sokona, E. Farahani, S. Kadner, et al. (eds.). Cambridge University Press, Cambridge, UK, and New York. LINK↩
This range is based on a New Climate Economy staff review of recent projections, including:19% in the New Policies Scenario and 25% in the Current Policiesscenario in: International Energy Agency (IEA), 2013. World Energy Outlook 2013. Paris. LINK26% in the 6DS scenario in: IEA, 2012. Energy Technology Perspectives 2012: Pathways to a Clean Energy System. Paris. LINK27% estimate in: US Energy Information Administration (EIA), 2013. International Energy Outlook. DOE/EIA-0484(2013). Washington, DC. LINK29–33% range provided in baselines developed for: GEA, 2012. Global Energy Assessment – Toward a Sustainable Future, 2012. Cambridge University Press, Cambridge, UK, and New York, and International Institute for Applied Systems Analysis, Laxenburg, Austria. LINK↩
The World Bank, n.d. Global Economic Monitor (GEM) Commodities.↩
International Energy Agency (IEA), 2011. Energy for All: Financing Access for the Poor. Special early excerpt of the World Energy Outlook 2011. First presented at the Energy For All Conference in Oslo, Norway, October 2011. LINK↩
See, e.g.: European Climate Foundation (ECF), 2014. Europe’s Low-carbon Transition: Understanding the Challenges and Opportunities for the Chemical Sector. Brussels. LINK↩
Dechezleprêtre, A., Martin, R. and Mohnen, M., 2013. Knowledge Spillovers from Clean and Dirty Technologies: A Patent Citation Analysis. Centre for Climate Change Economics and Policy Working Paper No. 151 and Grantham Research Institute on Climate Change and the Environment Working Paper No. 135. London. LINK↩
PricewaterhouseCoopers (PwC), 2013. Decarbonisation and the Economy: An empirical analysis of the economic impact of energy and climate change policies in Denmark, Sweden, Germany, UK and The Netherlands. LINK↩
See: Brahmbhatt, M., Dawkins, E., Liu, J. and Usmani, F., 2014 (forthcoming). Decoupling Carbon Emissions from Economic Growth: A Review of International Trends. New Climate Economy contributing paper. World Resources Institute, Stockholm Environment Institute and World Bank. LINK
Also: Brinkley, C., 2014. Decoupled: successful planning policies in countries that have reduced per capita greenhouse gas emissions with continued economic growth. Environment and Planning C: Government and Policy, advance online publication. DOI:10.1068/c12202.↩
Climate Policy Initiative analysis for the New Climate Economy project, based on data from: IEA, 2012, Energy Technology Perspectives; OECD, 2012, Strategic Transport Infrastructure Needs to 2030; and OECD, 2006, Infrastructure to 2030. Low-carbon infrastructure includes some investment in carbon capture and storage (CCS), as projected by the IEA.↩
See Figure 11 in Part II, Section 5.2 of this Synthesis Report for more details.↩
International Energy Agency (IEA), 2012. Energy Technology Perspectives: How to Secure a Clean Energy Future. Paris. LINK
Organisation for Economic Co-operation and Development (OECD), 2012. Strategic Transport Infrastructure Needs to 2030. Paris. LINK
Organisation for Economic Co-operation and Development (OECD), 2006. Infrastructure to 2030. Paris. LINK↩
For a discussion, see: Stiglitz, J.E., Sen, A. and Fitoussi, J-P., Report by the Commission on the Measurement of Economic Performance and Social Progress. LINK↩
Eliasch, J., 2008. Climate Change: Financing Global Forests – the Eliasch Review. Her Majesty’s Government, London. LINK↩
IEA, 2011. Energy for All: Financing Access for the Poor.↩
See: Hamilton, K., Brahmbhatt, M., Bianco, N., and Liu, J.M., 2014. Co-benefits and Climate Action. New Climate Economy contributing paper. World Resources Institute, Washington, DC. LINK↩
Hamilton, K., Brahmbhatt, M., Bianco, N. and Liu, J.M., 2014 (forthcoming). Co-benefits and Climate Action. New Climate Economy contributing paper. World Resources Institute, Washington, DC. LINK
Particulate matter (PM), a mix of tiny solid and liquid particles suspended in the air, affects more people than any other air pollutant. The most health-damaging particles have a diameter of 10 microns or less, which can penetrate the lungs; these are referred to as PM10. In many cities, the concentration of particles under 2.5 microns is also measured; this is PM2.5. See: World Health Organization (WHO), 2014. Ambient (outdoor) air quality and health. Fact Sheet No. 313. Geneva. LINK For global PM2.5 mortality estimates, see: WHO, 2014. Burden of Disease from Ambient Air Pollution for 2012.↩
Teng, F., 2014 (forthcoming). China and the New Climate Economy. New Climate Economy contributing paper. Tsinghua University. LINK↩
See Klevnäs, P. and Korsbakken, J. I., 2014. A Changing Outlook for Coal Power. New Climate Economy contributing paper. Stockholm Environment Institute, Stockholm. LINK↩
See Chapter 2: Cities for an in-depth discussion.↩
See, e.g., Gwilliam, K. M., 2002. Cities on the Move: A World Bank Urban Transport Strategy Review. The World Bank, Washington, DC. LINK
For a more recent discussion, focused on Africa, see: Schwela, D. and Haq, G., 2013. Transport and Environment in Sub-Saharan Africa. SEI policy brief. Stockholm Environment Institute, York, UK. LINK↩
For an in-depth discussion of these issues, see: Denton, F. and Wilbanks, T., 2014. Chapter 20: Climate-Resilient Pathways: Adaptation, Mitigation, and Sustainable Development. In Climate Change 2014: Impacts, Adaptation, and Vulnerability. Part A: Global and Sectoral Aspects. Contribution of Working Group II to the Fifth Assessment Report of the Intergovernmental Panel on Climate Change. C.B. Field, V.R. Barros, D.J. Dokken, K.J. Mach, M.D. Mastandrea, et al. (eds.). Cambridge University Press, Cambridge, UK, and New York. LINK
For practical guidance on “climate-proofing” and ways to identify adaptation needs, evaluate options, and plan and implement adaptation, see: PROVIA, 2013. PROVIA Guidance on Assessing Vulnerability, Impacts and Adaptation to Climate Change. Consultation document. United Nations Environment Programme, Nairobi, Kenya. LINK↩
Chapter 3: Land Use of the main report discusses climate-smart agriculture in greater detail.↩
Oxford Economics, 2014 (forthcoming).The Economic Impact of Taxing Carbon. New Climate Economy contributing paper. Oxford, UK. LINK↩
IPCC, 2014. Summary for Policymakers (IPCC AR5, Working Group III). See Table SPM.2.↩
See endnote 15 for GDP growth projections to 2030.↩
See: Bosetti V., Carraro, C., Galeotti, M., Massetti, E. and Tavoni, M., 2006. WITCH: A World Induced Technical Change Hybrid Model. The Energy Journal, 27. 13–37. LINK
Gillingham, K., Newell, R. G. and Pizer, W. A., 2008. Modeling endogenous technological change for climate policy analysis. Energy Economics, 30 (6). 2734–2753. DOI: 10.1016/j.eneco.2008.03.001.
Dellink, R., Lanzi, E., Chateau, J., Bosello, F., Parrado, R. and de Bruin, K., 2014. Consequences of Climate Change Damages for Economic Growth: A Dynamic Quantitative Assessment. Organisation for Economic Co-operation and Development, Economics Department Working Papers No. 1135. OECD Publishing, Paris. LINK↩
Chateau, J., Saint-Martin A. and Manfredi, T., 2011. Employment Impacts of Climate Change Mitigation Policies in OECD: A General-Equilibrium Perspective. Organisation for Economic Co-operation and Development, Environment Working Papers No. 32. OECD Publishing, Paris. LINK↩
Chateau et al., 2011. Employment Impacts of Climate Change Mitigation Policies in OECD.↩
ECF, 2014. Europe’s Low-carbon Transition: Understanding the Challenges and Opportunities for the Chemical Sector.↩
Ferroukhi, R., Lucas, H., Renner, M., Lehr, U., Breitschopf, B., Lallement, D., and Petrick, K., 2013. Renewable Energy and Jobs. International Renewable Energy Agency, Abu Dhabi. LINK↩
The World Coal Association estimates that 7 million people are directly employed by the industry. LINK [Accessed 30 August 2014.]↩
Organisation for Economic Co-operation and Development (OECD), 2012 The Jobs Potential of a Shift towards a Low-carbon Economy, Paris. LINK↩
This and the next two paragraphs draw on insights presented in a special issue of the International Labour Organization’s International Journal of Labour Research (Vol. 2, Issue 2, 2010): Climate Change and Labour: The Need for a “Just Transition”. LINK↩
For lessons from trade liberalisation adjustment experience, see: Porto, G., 2012. The Cost of Adjustment to Green Growth Policies: Lessons from Trade Adjustment Costs. Research Working Paper No. WPS 6237. The World Bank, Washington, DC. LINK↩
The Global Subsidies Initiative, established by the International Institute for Sustainable Development, has produced several case studies of fossil fuel subsidy reforms. LINK
For case studies of Indonesia and Ghana in particular, see:
Beaton, C. and Lontoh, L., 2010. Lessons Learned from Indonesia’s Attempts to Reform Fossil-Fuel Subsidies. Prepared for the Global Subsidies Initiative (GSI) of the International Institute for Sustainable Development. Geneva. LINK
Laan, T., Beaton, C. and Presta, B., 2010. Strategies for Reforming Fossil-Fuel Subsidies: Practical Lessons from Ghana, France and Senegal. Prepared for the Global Subsidies Initiative (GSI) of the International Institute for Sustainable Development. Geneva. LINK
For more detailed discussions on conditional cash-transfer programmes, see: Vagliasindi, M., 2012. Implementing Energy Subsidy Reforms: An Overview of the Key Issues. Policy Research Working Paper No. WPS 6122. The World Bank, Washington, DC. LINK↩
Organisation for Economic Cooperation and Development (OECD), 2013. Pricing Carbon: Policy Perspectives. Paris. LINK↩
In policy discussions, a 2°C average global temperature increase is often treated as the threshold between “safe” and “dangerous” levels of warming. The concept of “dangerous” climate change comes from the overarching objective of the United Nations Framework Convention on Climate Change (UNFCCC), namely “stabilization of greenhouse gas concentrations in the atmosphere at a level that would prevent dangerous anthropogenic interference with the climate system”. The goal of holding the increase in global average temperature below 2°C above pre-industrial levels was agreed at the UNFCCC Conference in Cancun in 2010. (LINK and LINK)
But the IPCC has made it clear that climate change impacts will vary by location, and substantial damages may occur well before 2°C is reached. See: IPCC, 2013, Summary for Policymakers (IPCC AR5, Working Group I), and IPCC, 2014, Summary for Policymakers (IPCC AR5, Working Group II).
There is also a growing scientific and policy literature on the risks associated with a global temperature rise of 4°C or more. See, for example, the Philosophical Transactions of the Royal Society A special issue published in 2011: Four Degrees and Beyond: the Potential for a Global Temperature Change of Four Degrees and its Implications. LINK
Also see: The World Bank, 2012. Turn Down the Heat: Why a 4°C Warmer World Must Be Avoided. Report for the World Bank by the Potsdam Institute for Climate Impact Research and Climate Analytics, Washington, DC. LINK↩
This estimate and emission reduction needs to 2030 are based on analysis of the IPCC’s review of emission scenarios, as shown in Figure SPM.4 and Table SPM.1 in IPCC, 2014. Summary for Policymakers (IPCC AR5, Working Group III). The GHG emission levels given here correspond to the median values for two emission pathways. One is consistent with baseline scenarios associated with a <33% probability that warming by 2100 relative to 1850-1900 will be less than 3°C, and a <50% probability that it will exceed 4°C. The other is consistent with mitigation scenarios associated with a >66% probability of keeping warming under 2°C. For a detailed discussion, see the New Climate Economy Technical Note, Quantifying Emission Reduction Potential. LINK↩
This and the estimate that follows are based on New Climate Economy staff analysis, using data from the World Bank, World Development Indicators 2014, and calculations for 2015-50 using illustrative GDP growth assumptions of 3% per year in 2015–30 and 2.5% a year in 2030–50. For further discussion, see: Brahmbhatt et al., 2014 (forthcoming). Decoupling Carbon Emissions from Economic Growth: A Review of International Trends.↩
All of this needs to be understood in the context that the IPCC assumes high levels of aerosols – small particles and liquid droplets – in the atmosphere that can prevent solar energy from reaching the Earth’s surface, allowing for higher levels of emissions until 2030. If those aerosols were reduced (e.g. due to tighter pollution controls), staying on a 2°C path after 2030 would require negative emissions in the second half of the century. This poses substantial technical challenges that remain unresolved.
See: Clarke, L. and Jiang, K., 2014. Chapter 6: Assessing Transformation Pathways. In Climate Change 2014: Mitigation of Climate Change. Contribution of Working Group III to the Fifth Assessment Report of the Intergovernmental Panel on Climate Change. O. Edenhofer, R. Pichs-Madruga, Y. Sokona, E. Farahani, S. Kadner, et al. (eds.). Cambridge University Press, Cambridge, UK, and New York. LINK↩
For a detailed outline of the data sources and methodology, see the New Climate Economy Technical Note, Quantifying Emission Reduction Potential. LINK↩
See Clarke and Jiang, 2014. Chapter 6: Assessing Transformation Pathways.↩
See IPCC, 2014. Summary for Policymakers (IPCC AR5, Working Group III).↩
See the New Climate Economy Technical Note, Quantifying the Multiple Benefits from Low Carbon Actions. LINK↩
McKinsey & Company, 2014 (forthcoming). Global GHG Abatement Cost Curve v3.0. Version 2.1 is available at: LINK↩
For a detailed outline of the data sources and methodology, see the New Climate Economy Technical Note, Quantifying the Multiple Benefits from Low-Carbon Actions: A Preliminary Analysis. LINK↩
A number of market indices have been launched, such as the Resource Efficiency Leaders Index LINK, which show systematic outperformance against the stock market as a whole through over-weighting those companies which are resource efficiency leaders in their sectors (greater than 70% since 2008 in the case of RESSEFLI).↩
World Business Council on Sustainable Development, 2013. Reporting Matters 2013 Baseline Report. LINK↩
“Net emissions” takes into account the possibility of storing and sequestering some emissions. See:
Haites, E., Yamin, F. and Höhne, N., 2013. Possible Elements of a 2015 Legal Agreement on Climate Change, Working Paper N°16/13, Institute for Sustainable Development and International Relations (IDDRI), Paris. LINK
Höhne, N.. van Breevoort, P., Deng, Y., Larkin, J. and Hänsel, G., 2013. Feasibility of GHG emissions phase-out by mid-century. Ecofys, Cologne, Germany. LINK↩
Seto, K.C. and Dhakal, S., 2014. Chapter 12: Human Settlements, Infrastructure, and Spatial Planning. In Climate Change 2014: Mitigation of Climate Change. Contribution of Working Group III to the Fifth Assessment Report of the Intergovernmental Panel on Climate Change. O. Edenhofer, R. Pichs-Madruga, Y. Sokona, E. Farahani, S. Kadner, et al. (eds.). Cambridge University Press, Cambridge, UK, and New York. LINK↩
The Intergovernmental Panel on Climate Change (IPCC) estimates that in 2010, urban areas accounted for 67–76% of global energy use and 71–76% of global CO2 emissions from final energy use. See: Seto andDhakal, 2014. Chapter 12: Human Settlements, Infrastructure, and Spatial Planning.↩
Seto and Dhakal, 2014. Chapter 12: Human Settlements, Infrastructure, and Spatial Planning.↩
United Nations (UN), 2014. World Urbanization Prospects, the 2014 revision. UN Department of Economic and Social Affairs, Population Division. LINK
Seto, K.C., Güneralp, B. and Hutyra, L.R., 2012. Global forecasts of urban expansion to 2030 and direct impacts on biodiversity and carbon pools. Proceedings of the National Academy of Sciences, 109(40). 16083–16088. DOI:10.1073/pnas.1211658109.↩
Dargay, J., Gatley D., and Sommer M., 2007. Vehicle ownership and income growth, worldwide: 1960-2030. The Energy Journal, 28(4). 143–170. LINK↩
Litman, T., 2014 (forthcoming). Analysis of Public Policies that Unintentionally Encourage and Subsidize Urban Sprawl. New Climate Economy contributing paper. Victoria Transport Policy Institute, commissioned by the London School of Economics and Political Science. LINK↩
Litman, 2014 (forthcoming). Analysis of Public Policies that Unintentionally Encourage and Subsidize Urban Sprawl.↩
The World Bank and Development Research Center of the State Council, 2014. Urban China: Toward Efficient, Inclusive, and Sustainable Urbanization. Washington, DC. LINK↩
Fan, J., 2006. Industrial Agglomeration and Difference of Regional Labor Productivity: Chinese Evidence with International Comparison. Economic Research Journal, 11. 73–84. LINK↩
Gouldson, A., Colenbrander, S., McAnulla, F., Sudmant, A., Kerr, N., Sakai, P., Hall, S. and Kuylenstierna, J.C.I., 2014 (forthcoming). Exploring the Economic Case for Low-Carbon Cities. New Climate Economy contributing paper. Sustainability Research Institute, University of Leeds, and Stockholm Environment Institute, York, UK. LINK↩
These are New Climate Economy (NCE) estimates based on analysis of global infrastructure requirements by the International Energy Agency (IEA, 2012. Energy Technology Perspectives 2012) and the Organisation for Economic Co-operation and Development (OECD, 2007. Infrastructure to 2030) for road investment, water and waste, telecommunications, and buildings (energy efficiency), and conservative assumptions about the share of urban infrastructure and the infrastructure investment costs (based on multiple sources) of sprawling versus smarter urban development. This should be treated as an indicative order of magnitude global estimate. This estimate is corroborated by evidence from Litman, 2014 (forthcoming), Analysis of Public Policies that Unintentionally Encourage and Subsidize Urban Sprawl, which looks at the infrastructure and public service costs of urban sprawl in the United States.↩
Arrington, G.B. and Cervero, R., 2008. Effects of TOD on Housing, Parking, and Travel. Transit Cooperative Research Programme Report No. 128. LINK↩
See: Laconte, P., 2005. Urban and Transport Management – International Trends and Practices. Paper presented at the Joint International Symposium: Sustainable Urban Transport and City. Shanghai. LINK
For more on Houston’s efforts, see Box 7 in the Chapter 2: Cities in our main report.↩
Carrigan, A., King, R., Velásquez, J.M., Duduta, N., and Raifman, M., 2013. Social, Environmental and Economic Impacts of Bus Rapid Transit. EMBARQ, a programme of the World Resources Institute, Washington, DC. LINK↩
The World Bank and Development Research Center of the State Council, 2014. Urban China. ↩
Current data from: DeMaio, P., 2013. The Bike-sharing World – End of 2013. The Bike-sharing Blog, 31 December. LINK (The data cited by DeMaio come from The Bike-sharing World Map LINK a Google map of known bike-sharing schemes.)
Data for 2000 from: Midgley, P., 2011. Bicycle-Sharing Schemes: Enhancing Sustainable Mobility in Urban Areas. United Nations Department of Economic and Social Affairs, Commission on Sustainable Development. Background Paper No. 8, CSD19/2011/BP8. LINK↩
Floater, G., Rode, P., Zenghelis, D., Carrero, M.M., Smith, D., Baker K., and Heeckt, C., 2013. Stockholm: Green Economy Leader Report. LSE Cities, London School of Economics and Political Science, London. LINK↩
United Nations Environment Programme (UNEP), 2009. Sustainable Urban Planning in Brazil. Nairobi. LINK
See also: Barth, B., 2014. Curitiba: the Greenest City on Earth. The Ecologist. 15 March. LINK↩
Xinhua, 2014. China unveils Landmark Urbanization Plan. 16 March. LINK↩
The World Bank, 2013. Planning and Financing Low-Carbon, Livable Cities. Washington DC. LINK↩
The World Bank, 2013. Planning and Financing Low-Carbon, Livable Cities.↩
A further 8% of agricultural land is moderately degraded, and the amount is increasing. See: Food and Agriculture Organization of the United Nations (FAO), 2011. The State of the World’s Land and Water Resources for Food and Agriculture (SOLAW) –Managing Systems at Risk. Rome. LINK
See also work by partners of the Economics of Land Degradation: A Global Initiative for Sustainable Land Management, launched in 2013: LINK↩
Kissinger, G., Herold, M. and de Sy, V., 2012. Drivers of Deforestation and Forest Degradation: A Synthesis Report for REDD+ Policymakers. Lexeme Consulting, Vancouver. LINK↩
IPCC, 2014. Summary for Policymakers. In Climate Change 2014: Mitigation of Climate Change. Contribution of Working Group III to the Fifth Assessment Report of the Intergovernmental Panel on Climate Change. O. Edenhofer, R. Pichs-Madruga, Y. Sokona, E. Farahani, S. Kadner, et al. (eds.). Cambridge University Press, Cambridge, UK, and New York. LINK
The IPCC reports net total anthropogenic GHG emissions from agriculture, forestry and other land use (AFOLU) in 2010 as 10–12 Gt CO2e, or 24% of all GHG emissions in 2010. The AFOLU chapter further specifies that GHG emissions from agriculture in 2000–2009 were 5.0–5.8 Gt CO2e per year. See: Smith, P. and Bustamante, M., 2014. Chapter 11: Agriculture, Forestry and Other Land Use (AFOLU). In Climate Change 2014: Mitigation of Climate Change. Contribution of Working Group III to the Fifth Assessment Report of the Intergovernmental Panel on Climate Change. O. Edenhofer, R. Pichs-Madruga, Y. Sokona, E. Farahani, S. Kadner, et al. (eds.). Cambridge University Press, Cambridge, UK, and New York. LINK↩
The 11% global emissions from the FOLU component of AFOLU is from Searchinger, T., Hanson, C., Ranganathan, J., Lipinski, B., Waite, R., Winterbottom, R., Dinshaw, A. and Heimlich, R., 2013. Creating a Sustainable Food Future: A Menu of Solutions to Sustainably Feed More than 9 Billion People by 2050. World Resources Report 2013-14: Interim Findings. World Resources Institute, the World Bank, United Nations Environment Programme (UNEP), United Nations Development Programme (UNDP), Washington, DC. LINK
Searchinger et al. then attribute a further 13% of global GHG emissions to agriculture directly. The estimate of roughly 20% of global emissions from gross deforestation is derived from adding estimates from carbon savings from reforestation and afforestation to estimates of emissions from net deforestation in Houghton, R. A., 2013. The emissions of carbon from deforestation and degradation in the tropics: past trends and future potential.↩
Food and Agriculture Organization of the United Nations (FAO), 2010. Global Forest Resources Assessment 2010. FAO Forestry Paper 163. Rome. LINK
Also see: Food and Agriculture Organization of the United Nations and European Commission Joint Research Centre, 2012. Global Forest Land-Use Change 1990–2005. By E.J. Lindquist, R. D’Annunzio, A. Gerrand, K., MacDicken, F., Achard, R., Beuchle, A., Brink, H.D., Eva, P., Mayaux, J., San-Miguel-Ayanz and H-J. Stibig. FAO Forestry Paper 169. Rome. LINK↩
Food and Agriculture Organization of the United Nations (FAO), 2012. Global Forest Land-use Change 1990–2005. Rome. LINK
Houghton, R.A., 2008. Improved estimates of net carbon emissions from land cover change in the tropics for the 1990s. In TRENDS: A Compendium of Data on Global Change. Carbon Dioxide Information Analysis Center, Oak Ridge National Laboratory, U.S. Department of Energy, Oak Ridge, TN, US. LINK
International Energy Agency (IEA), 2012. World Energy Outlook 2012. Paris. LINK
United Nations Environment Programme (UNEP), 2012. The Emissions Gap Report 2012. Nairobi, Kenya. LINK
US Energy Information Administration (EIA), 2012. Annual Energy Outlook 2012 –with Projections to 2035. Washington, DC. LINK↩
The World Bank, 2007. World Development Report 2008: Agriculture for Development. Washington, DC. LINK↩
Organisation for Economic Co-operation and Development (OECD) and Food and Agriculture Organization of the United Nations (FAO), 2013. OECD-FAO Agricultural Outlook 2014-2023. Paris and Rome. LINK ↩
Searchinger et al., 2013. Creating a Sustainable Food Future.↩
See: The new green revolution: A bigger rice bowl. The Economist, 10 May 2014. LINK
Rice in particular is a crop that farmers can replant from their own harvests without yield loss, so it is hard to recover the cost of private breeding.↩
Beintema, N., Stads, G.-J., Fuglie, K., and Heisey, P., 2012. ASTI Global Assessment of Agricultural R&D Spending. International Food Policy Research Institute, Washington, DC, and Global Forum on Agricultural Research, Rome. LINK↩
Gale, F., 2013. Growth and Evolution in China’s Agricultural Support Policies. Economic Research Service Report No. 153. US Department of Agriculture. LINK↩
Grossman, N., and Carlson, D., 2011. Agriculture Policy in India: The Role of Input Subsidies. USITC Executive Briefings on Trade.↩
Organisation for Economic Co-operation and Development (OECD), 2013. Agricultural Policy Monitoring and Evaluation 2013. Paris. LINK↩
Zhang, W., Dou, Z., He, P., Ju, X.-T., Powlson, D., et al., 2013. New technologies reduce greenhouse gas emissions from nitrogenous fertilizer in China. Proceedings of the National Academy of Sciences, 110(21). 8375–8380. DOI:10.1073/pnas.1210447110.↩
Hoda. A., 2014. Low Carbon Strategies for India in Agriculture and Forestry. Unpublished paper presented at The Indian Council for Research on International Economic Relations (ICRIER) Workshop on the New Climate Economy, ICRIER, India Habitat Center, New Delhi, 15 April.↩
Based on work by partners of the Economics of Land Degradation: A Global Initiative for Sustainable Land Management launched in 2013 and based at the German Ministry for Economic Cooperation and Development. LINK [Accessed 29 April 2014.]
Scientific coordination of the ELD initiative is provided by the United Nations University – Institute for Water, Environment and Health (UNU-INWEH). UNEP, IUCN, and The International Food Policy Research Institute are key technical partners.↩
Berry, L., Olson, J., and Campbell, D., 2003. Assessing the extent, cost and impact of land degradation at the national level: findings and lessons learned from seven pilot case studies. Global Mechanism. LINK↩
Dang, Y., Ren, W., Tao, B., Chen, G., Lu, C., et al., 2014. Climate and Land Use Controls on Soil Organic Carbon in the Loess Plateau Region of China. PLoS ONE, 9(5). e95548. DOI:10.1371/journal.pone.0095548.↩
Cooper, P.J.M., Cappiello, S., Vermeulen, S.J., Campbell, B.M., Zougmoré, R. and Kinyangi, J., 2013. Large-Scale Implementation of Adaptation and Mitigation Actions in Agriculture. CCAFS Working Paper No. 50. CGIAR Research Program on Climate Change, Agriculture and Food Security, Copenhagen. LINK↩
Photos Till Niermann, GNU free documentation License v1.2 (1990) and Erick Fernandes (2012).↩
World Resources Institute, 2008. World Resources 2008: Roots of Resilience – Growing the Wealth of the Poor. Produced by WRI in collaboration with United Nations Development Programme, United Nations Environment Programme, and the World Bank, Washington, DC. LINK↩
Sendzimir, J., Reij, C. P. and Magnuszewski, P., 2011. Rebuilding Resilience in the Sahel: Regreening in the Maradi and Zinder Regions of Niger. Ecology and Society, 16(3), Art. 1. DOI:10.5751/ES-04198-160301.
And: Pye-Smith, C., 2013. The Quiet Revolution: how Niger’s farmers are re-greening the parklands of the Sahel. ICRAF Trees for Change, No. 12. World Agroforestry Center, Nairobi. LINK↩
Winterbottom, R., Reij, C., Garrity, D., Glover, J., Hellums, D., McGahuey, M. and Scherr, S., 2013. Improving Land and Water Management. Creating a Sustainable Food Future, Installment Four. World Resources Institute, Washington, DC. LINK↩
Food and Agriculture Organization of the United Nations (FAO), 2014. State of the World’s Forests 2014: Enhancing the Socioeconomic Benefits from Forests. Rome. LINK
See also: IEA, 2012. World Energy Outlook 2012.↩
WWF, 2012. Chapter 4: Forests and Wood Products, In WWF Living Forest Report. Washington, DC. LINK↩
Rautner, M., Leggett, M., and Davis, F., 2013. The Little Book of Big Deforestation Drivers. Global Canopy Programme, Oxford. LINK↩
Kissinger et al., 2012. Drivers of Deforestation and Forest Degradation.↩
See, e.g.: Leonard, S., 2014. Forests, Land Use and The Green Climate Fund: Open for Business? Forests Climate Change, 5 June. LINK↩
Minnemeyer, S., Laestadius, L., Sizer, N., Saint-Laurent, C., and Potapov, P., 2011. Global Map of Forest Landscape Restoration Opportunities. Forest and Landscape Restoration project, World Resources Institute, Washington, DC. LINK
They estimate that there are 2.314 billion ha of lost and degraded forest landscapes around the world (relative to land that could support forests in the absence of human interference; precise data and interpretation confirmed by map author Lars Laestadius, 14 August 2014).
The Aichi Target #15 states: “By 2020, ecosystem resilience and the contribution of biodiversity to carbon stocks has been enhanced, through conservation and restoration, including restoration of at least 15 per cent of degraded ecosystems, thereby contributing to climate change mitigation and adaptation and to combating desertification.”15% of 2.314 billion ha is 347 million ha. LINK [Accessed 22 July 2014.]↩
The estimate is a doubling of the estimate of US$85 billion given for 150 million ha in Verdonne, M., Maginnis, S., and Seidl, A., 2014 (forthcoming). Re-examining the Role of Landscape Restoration in REDD+. International Union for Conservation of Nature. Thus, the estimate is conservative, as it ignores the last 50 million ha of the 350 million ha estimate. Their calculation assumes 34% of the restoration is agroforestry, 23% is planted forests, and 43% is improved secondary and naturally regenerated forests, all distributed across different biomes. Benefits assessed included timber products, non-timber forest products, fuel, better soil and water management remunerated through crop higher yields, and recreation.↩
This is based on an average from applying per ha estimates of mitigation in the literature, which yields roughly 2 Gt CO2e for 350 million ha, and taking a range of 50% above and below to account for the carbon differences that would ensue from different mixes of agroforestry, mosaic restoration in temperate zones, and natural regeneration of tropical moist forest, for example, within the total area restored. More details are in the forthcoming New Climate Economy Technical Note, Quantifying the Multiple Benefits from Low Carbon Actions: A Preliminary Analysis. LINK↩
Parry, A., James, K., and LeRoux, S., 2014 (forthcoming). Strategies to Achieve Economic and Environmental Gains by Reducing Food Waste. New Climate Economy contributing paper. Waste & Resources Action Programme (WRAP), Banbury, UK. LINK↩
Estimates vary between 49% to 2011 or 54% to 2012, depending on methodology and data sources. See BP, 2013. BP Statistical Review of World Energy June 2013. London. LINK↩
Global primary energy consumption rose by 3,388 million tonnes of oil equivalent (Mtoe) from 2000 to 2013, to 12,730 Mtoe; in that same period, China’s primary energy consumption rose by 1,872 Mtoe, to 2852.4 Mtoe in 2013. See BP, 2014. BP Statistical Review of World Energy June 2014. London. LINK↩
This range is based on a New Climate Economy staff review of recent projections, including:
19% in the New Policies Scenario and 25% in the Current Policiesscenario in: International Energy Agency (IEA), 2013. World Energy Outlook 2013. Paris. LINK
26% in the 6DS scenario in: IEA, 2012. Energy Technology Perspectives 2012.
27% estimate in: US Energy Information Administration (EIA), 2013. International Energy Outlook. DOE/EIA-0484(2013). Washington, DC. LINK
29–33% range provided in baselines developed for: GEA, 2012. Global Energy Assessment – Toward a Sustainable Future, 2012. Cambridge University Press, Cambridge, UK, and New York, and International Institute for Applied Systems Analysis, Laxenburg, Austria. LINK↩
This includes an estimated US$23 trillion in energy supply and US$24 trillion across transport engines and energy use in buildings and industry. See Chapter 6: Finance in our main report for more discussion of future energy infrastructure needs.↩
For energy-related emissions outside direct industry emissions, see all sectors except AFOLU and waste in Figure TS.3a in: IPCC, 2014. Technical Summary. In Climate Change 2014: Mitigation of Climate Change. Contribution of Working Group III to the Fifth Assessment Report of the Intergovernmental Panel on Climate Change. O. Edenhofer, R. Pichs-Madruga, Y. Sokona, E. Farahani, S. Kadner, et al. (eds.). Cambridge University Press, Cambridge, UK, and New York. LINK
For direct energy-related emissions in industry, see Table 10.2 of Fischedick, M. and Roy, J., 2014. Chapter 10: Industry. In Climate Change 2014: Mitigation of Climate Change. Contribution of Working Group III to the Fifth Assessment Report of the Intergovernmental Panel on Climate Change. O. Edenhofer, R. Pichs-Madruga, Y. Sokona, E. Farahani, S. Kadner, et al. (eds.). Cambridge University Press, Cambridge, UK, and New York. LINK↩
The World Bank, n.d. Global Economic Monitor (GEM) Commodities. ↩
Planning Commission of the Government of India, 2013. India Energy Security Scenarios 2047. LINK↩
IEA, 2013. World Energy Outlook 2013.
Planning Commission of the Government of India, 2013. India Energy Security Scenarios 2047.
EIA, 2013. International Energy Outlook 2013.
Feng, L.Q., 2012. Analysis on Coal Import Origin of China (in Chinese). Master thesis, Inner Mongolia University. LINK
Wood Mackenzie, 2013. International thermal coal trade: What Will the Future Look Like for Japanese Buyers? Presentation for the Clean Coal Day 2013 International Symposium, Tokyo, 4-5 September 2013.↩
Hamilton, K., Brahmbhatt, M., Bianco, N. and Liu, J.M., 2014 (forthcoming). Co-benefits and Climate Action. New Climate Economy contributing paper. World Resources Institute, Washington, DC. LINK↩
See Klevnäs, P. and Korsbakken, J.I., 2014 (forthcoming). A Changing Outlook for Coal Power. New Climate Economy contributing paper. Stockholm Environment Institute, Stockholm. LINK↩
IEA, 2013. World Energy Outlook 2013.↩
11 Gt CO2 corresponds to the total reductions in the 450 scenario relative to the Current Policies scenario. See IEA, 2013, World Energy Outlook 2013. ↩
The estimated range is likely cost-effective reductions of 4.7-6.6 GtCO2 per year. For further discussion of the scope and limitations of these estimates, see the New Climate Economy technical note, Quantifying Emission Reduction Potential. LINK↩
This section focuses on electricity, but options to use renewable energy also exist across heating, industry, and transport systems. A recent assessment by the International Renewable Energy Agency (IRENA) also identifies significant opportunities for cost-effective uses across these sectors. See: International Renewable Energy Agency (IRENA), 2014. REmap 2030: A Renewable Energy Roadmap. Abu Dhabi. LINK↩
International Energy Agency (IEA), 2014. Electricity Information (2014 preliminary edition). IEA Data Services. LINK↩
Module prices: International Energy Agency (IEA), 2014. Energy Technology Perspectives 2014. Paris. LINK↩
Cost comparisons quoted here do not in general include full system costs / grid costs, as discussed in subsequent sections. For cost estimates and statements on auctions, see:
REN21, 2014. Renewables 2014 Global Status Report. Paris: Renewable Energy Policy Network for the 21st Century. LINK
And:
International Energy Agency (IEA), 2013. Technology Roadmap: Wind Energy – 2013 Edition. Paris. LINK↩
Liebreich, M., 2014. Keynote address, Bloomberg New Energy Finance Summit 2014, New York, April 7. LINK↩
IEA, 2014. Energy Technology Perspectives 2014 (module prices).↩
Ernst & Young, 2013. Country Focus: Chile. RECAI: Renewable Energy Country Attractiveness Index, 39 (November), pp.24–25. LINK↩
REN21, 2014. Renewables 2014 Global Status Report.↩
International Renewable Energy Agency (IRENA), 2012. Solar Photovoltaics. Renewable Energy Technologies: Cost Analysis Series, Volume 1: Power Sector, Issue 4/5. International Renewable Energy Agency, Abu Dhabi. LINK↩
For illustration, the IEA’s central scenario (New Policies) envisions solar and wind combined adding more electricity production than either coal or gas until 2035. See: IEA, 2013. World Energy Outlook 2013.↩
Channell, J., Lam, T., and Pourreza, S., 2012. Shale and Renewables: a Symbiotic Relationship. A Longer-term Global Energy Investment Strategy Driven by Changes to the Energy Mix. Citi Research report, September 2012. LINK
EIA, 2014. Levelized Cost and Levelized Avoided Cost of New Generation Resources in the Annual Energy Outlook 2014. LCOE for conventional coal in Table 1.
International Energy Agency (IEA), 2014. Power Generation in the New Policies and 450 Scenarios – Assumed investment costs, operation and maintenance costs and efficiencies in the IEA World Energy Investment Outlook 2014. Capital costs for subcritical steam coal plants. Spreadsheet available at: LINK
Nemet, G.F., 2006. Beyond the learning curve: factors influencing cost reductions in photovoltaics. Energy Policy, 34(17). 3218–3232. DOI:10.1016/j.enpol.2005.06.020.↩
BP, 2013. BP Statistical Review of World Energy June 2013.↩
IPCC, 2014. Summary for Policymakers (IPCC AR5, Working Group III).↩
For an in-depth discussion of this topic, see Section 3.5 of Chapter 4: Energy of our report, as well as the NCE background paper on which it is based: Lazarus, M., Tempest, K., Klevnäs, P. and Korsbakken, J.I., 2014. Natural Gas: Guardrails for a Potential Climate Bridge. New Climate Economy contributing paper. Stockholm Environment Institute, Stockholm. LINK↩
See, e.g., IPCC, 2014, Summary for Policymakers (IPCC AR5, Working Group III), and the range of scenarios in GEA, 2012. Global Energy Assessment.
Also: IPCC, 2005. IPCC Special Report on Carbon Dioxide Capture and Storage. Prepared by Working Group III of the Intergovernmental Panel on Climate Change (Metz, B., O. Davidson, H.C. de Coninck, M. Loos, and L.A. Meyer, eds.). Cambridge University Press, Cambridge, UK, and New York. LINK↩
Based on analysis by the New Climate Economy project team, in the IEA’s 2°C Scenario (2DS), the annual investment rate in CCS-equipped facilities would reach almost US$30 billion/year in 2020, with cumulative investment reaching more than US$100 billion. Projections are based on data from IEA, 2012, Energy Technology Perspectives 2012.
Actual investment in 2007–2012 averaged only US$2 billion per year. See: IEA, 2013. Technology Roadmap: Carbon Capture and Storage 2013.↩
IEA, 2011. Energy for All.↩
For an in-depth discussion of these issues, see Section 3.4 of Chapter 4: Energy of our report, as well as: Jürisoo, M., Pachauri, S., Johnson, O. and Lambe, F., 2014. Can Low-Carbon Options Change Conditions for Expanding Energy Access in Africa? SEI and IIASA discussion brief, based on a New Climate Economy project workshop. Stockholm Environment Institute, Stockholm, and International Institute for Applied Systems Analysis, Laxenburg, Austria. LINK↩
International Energy Agency, 2013. Energy efficiency market report.↩
Planning Commission of the Government of India, 2013. India Energy Security Scenarios 2047.↩
Analysis for the Global Commission, drawing on: IEA, 2012. World Energy Outlook 2012; GEA, 2012. Global Energy Assessment, and Bruckner et al., 2014. Chapter 7: Energy systems.↩
Organisation for Economic Co-operation and Development (OECD), 2013. Inventory of Estimated Budgetary Support and Tax Expenditures for Fossil Fuels 2013. OECD Publishing, Paris. DOI: 10.1787/9789264187610-en.↩
IEA, 2013. World Energy Outlook 2013.↩
The International Monetary Fund took a different approach to calculating the value of fossil fuel subsidies, by including the cost of unpriced externalities such as climate change. The agency estimated a global value for such subsidies of US$2 trillion annually. See: International Monetary Fund (IMF), 2013. Energy Subsidy Reform: Lessons and Implications. Washington, DC. LINK↩
IEA, 2013. World Energy Outlook 2013.↩
The World Bank, 2014. State and Trends of Carbon Pricing 2014. Washington, DC. LINK
Note: this statistic includes Australia, which has since removed its carbon tax.↩
Climate Policy Initiative analysis for the New Climate Economy project, based on data from:
International Energy Agency (IEA), 2012. Energy Technology Perspectives: How to Secure a Clean Energy Future. Paris. LINK
Organisation for Economic Co-operation and Development (OECD), 2012. Strategic Transport Infrastructure Needs to 2030. Paris. LINK
Organisation for Economic Co-operation and Development (OECD), 2006. Infrastructure to 2030. Paris. LINK↩
Climate Policy Initiative analysis for the New Climate Economy project, based on data from: IEA, 2012, Energy Technology Perspectives; OECD, 2012, Strategic Transport Infrastructure Needs to 2030; and OECD, 2006, Infrastructure to 2030. Ratio of GDP is estimated by calculating GDP for 2015–2030 per the global growth rate projected in:
Organisation for Economic Co-operation and Development (OECD), 2012. Medium and Long-Term Scenarios for Global Growth and Imbalances. OECD Economic Outlook, Volume 2012, Issue 1. Paris. LINK↩
Kennedy. C. and Corfee-Morlot, J., 2012. Mobilising Private Investment in Low-Carbon, Climate-Resilient Infrastructure. Organisation for Economic Cooperation and Development (OECD) Working Papers. OECD, Paris. LINK↩
Further details of policies to reform asset pricing are provided in Chapter 5: Economics of Change in our main report.↩
Climate Policy Initiative (CPI), 2014. Roadmap to a Low Carbon Electricity System in the U.S. and Europe. San Francisco, CA, US. LINK↩
Bloomberg New Energy Finance (BNEF), 2013. Development Banks: Breaking the US$100 billion a year barrier. New York. LINK↩
Climate Policy Initiative analysis based on data from Bloomberg New Energy Finance.↩
BNEF, 2013. Development Banks: Breaking the US$100 billion a year barrier.↩
Dezem, V. and Lima, M.S., 2014. Wind-Farm Developers Win Biggest Share of Brazil Auction. Bloomberg. LINK↩
See: Nelson, D., Goggins, A., Hervé-Mignucci, M., Szambelan, S.J., and Zuckerman, J., 2014 (forthcoming). Moving to a Low Carbon Economy: The Financial Impact of the Low-Carbon Transition. New Climate Economy contributing paper. Climate Policy Initiative, San Francisco, CA, US. LINK↩
IEA, 2012. Energy Technology Perspectives.
International Energy Agency (IEA), 2014. World Energy Investment Outlook 2014. Paris. LINK
Also: Platts World Electric Power Database and Rystad UCube database.↩
This refers to a transition to a 2°C scenario from “business as usual”.↩
For an in-depth discussion of stranded assets, see Section 5.1 of Chapter 6: Finance in our main report, as well as the background paper from which it is derived: Nelson, D., Goggins, A., Hervé-Mignucci, M., Szambelan, S.J., Vladeck, T., and Zuckerman, J., 2014 (forthcoming). Moving to a Low Carbon Economy: The Impact of Different Transition Policy Pathways on the Owners of Fossil Fuel Resources and Assets. New Climate Economy contributing paper. Climate Policy Initiative, San Francisco, CA, US. LINK↩
Organisation for Economic Co-operation and Development (OECD), 2012. OECD Environmental Outlook to 2050. OECD Publishing, Paris. LINK↩
US Energy Information Administration, 2014. EIA projects modest needs for new electric generation capacity. Today in Energy, 16 July. LINK↩
International Energy Agency (IEA), 2013. Technology Roadmap: Energy Efficient Building Envelopes. Paris. LINK↩
Sperling, D. and Lutsey, N., 2009. Energy efficiency in passenger transportation. The Bridge, 39(2). 22–30. LINK↩
See: Google Inc., 2014. Helping our communities adapt to climate change. 19 March. LINK↩
Bloomberg New Energy Finance, 2014. China Out-spends the US for the First Time in $15bn Smart Grid Market. 18 February. LINK↩
US International Trade Commission, 2012. Remanufactured Goods: An Overview of the U.S. and Global Industries, Markets, and Trade. USITC Publication 4356. Washington, DC. LINK↩
Ellen MacArthur Foundation, 2012. Towards a Circular Economy. Vol. 1. Cowes, Isle of Wight, UK. LINK↩
Estimates are for 2010, as given in: Lucon, O. and Ürge‐Vorsatz, D., 2014. Chapter 9: Buildings. In Climate Change 2014: Mitigation of Climate Change. Contribution of Working Group III to the Fifth Assessment Report of the Intergovernmental Panel on Climate Change. O. Edenhofer, R. Pichs-Madruga, Y. Sokona, E. Farahani, S. Kadner, et al. (eds.). Cambridge University Press, Cambridge, UK, and New York. LINK↩
Ellen MacArthur Foundation, 2012. Towards a Circular Economy.↩
Xu, D., 2014. How to build a skyscraper in two weeks. For the 96% recycled steel figure and more data from Broad Group, see the company’s Sustainable Building brochure: LINK↩
National Institute of Building Sciences, 2014. Industry Proposes Innovative Method for Implementing Green Construction Code. LINK↩
Nordhaus, W.D., 2002. Modeling induced innovation in climate-change policy. In Technological change and the environment. A. Grübler, N. Nakicenovic, and W.D. Nordhaus (eds.). Resources for the Future, Washington, DC. 182–209.↩
Dechezleprêtre, A., Martin, R. and Mohnen, M., 2013. Knowledge Spillovers from Clean and Dirty Technologies: A Patent Citation Analysis. Centre for Climate Change Economics and Policy Working Paper No. 151 and Grantham Research Institute on Climate Change and the Environment Working Paper No. 135. London. LINK↩
Prahalad, C.K. and Hammond, A., 2002. Serving the world’s poor, profitably. Harvard Business Review, 80(9). 48–57, 124.↩
Hultman, et al., 2013. Green Growth Innovation.↩
Harvey, I., 2008. Intellectual Property Rights: The Catalyst to Deliver Low Carbon Technologies. Breaking the Climate Deadlock briefing paper. The Climate Group. LINK↩
Chiavari, J., and Tam, C., 2011. Good Practice Policy Framework for Energy Technology Research, Development and Demonstration (RD&D). Information Paper from the International Energy Agency. Paris. LINK↩
Organisation for Economic Co-operation and Development (OECD), 2012. Energy and Climate Policy: Bending the Technological Trajectory. Paris. LINK↩
The Pew Charitable Trusts, 2013. Advantage America: The U.S.-China Clean Energy Trade Relationship in 2011. Philadelphia, PA, US. LINK↩
The OECD and Eurostat have defined the sector thus: “The environmental goods and services industry consists of activities which produce goods and services to measure, prevent, limit, minimise or correct environmental damage to water, air and soil, as well as problems related to waste, noise and eco-systems. This includes cleaner technologies, products and services that reduce environmental risk and minimise pollution and resource use.”
See: OECD and Eurostat, 1999. The Environmental Goods and Services Industry: Manual for Data Collection and Analysis. Organisation for Economic Co-operation and Development, Paris, and Statistical Office of the European Communities, Brussels. LINK
Data cited are from: Office of the United States Trade Representative (USTR), 2014. WTO Environmental Goods Agreement: Promoting Made-in-America Clean Technology Exports, Green Growth and Jobs. Fact sheet, July 2014. LINK
Total global trade was estimated at US$18 trillion in 2012. See: United Nations Conference on Trade and Development, 2013. UNCTAD Handbook of Statistics 2013. Geneva. LINK↩
United Nations Environment Programme (UNEP), 2013. Green Economy and Trade – Trends, Challenges and Opportunities. LINK↩
Carbon Trust and Shell, 2013. A “MUST” WIN: Capitalising on New Global Low Carbon Markets to Boost UK Export Growth. LINK
The estimate uses the International Monetary Fund classification of emerging and developing economies: LINK↩
The US had a small trade surplus in the year reviewed, 2011. See: The Pew Charitable Trusts, 2013, Advantage America.↩
For an overview, see: Höhne, N., Ellermann, C. and Li, L., 2014. Intended Nationally Determined Contributions under the UNFCCC. Discussion paper. Ecofys, Cologne, Germany. LINK↩
The Intergovernmental Panel on Climate Change (IPCC) warns that historical GHG data are quite uncertain, especially for the more distant past (e.g. the 18th and 19th centuries). The allocation of historical responsibility also changes based on the starting point chosen (1750, 1850, or as late as 1990), the gases considered (CO2 or all GHGs), and whether emissions from land use, land use change and forestry (LULUCF) are included. Citing den Elzen et al., 2013 (see below), the IPCC notes that, for example, developed countries’ share of historical emissions is almost 80% when non-CO2 GHGs, LULUCF emissions and recent emissions are excluded, or about 47% when they are included. Citing Höhne et al., 2011 (see below), the IPCC adds: “As a general rule, because emissions of long‐lived gases are rising, while emissions of the distant past are highly uncertain, their influence is overshadowed by the dominance of the much higher emissions of recent decades.”
See: Victor, D. and Zhou, D., 2014. Chapter 1: Introductory Chapter. In Climate Change 2014: Mitigation of Climate Change. Contribution of Working Group III to the Fifth Assessment Report of the Intergovernmental Panel on Climate Change. O. Edenhofer, R. Pichs-Madruga, Y. Sokona, E. Farahani, S. Kadner, et al. (eds.). Cambridge University Press, Cambridge, UK, and New York. LINK
Den Elzen, M.G.J., Olivier, J.G.J., Höhne, N. and Janssens-Maenhout, G., 2013. Countries’ contributions to climate change: effect of accounting for all greenhouse gases, recent trends, basic needs and technological progress. Climatic Change, 121(2). 397–412. DOI:10.1007/s10584-013-0865-6.
Höhne, N., Blum, H., Fuglestvedt, J., Skeie, R. B., Kurosawa, A., et al., 2011. Contributions of individual countries’ emissions to climate change and their uncertainty. Climatic Change, 106(3). 359–391. DOI:10.1007/s10584-010-9930-6.↩
Victor and Zhou, 2014. Chapter 1: Introductory Chapter. See in particular Figures 1.4 and 1.6.↩
See Victor and Zhou, 2014, Chapter 1: Introductory Chapter, as well as: Winkler, H., Jayaraman, T., Pan, J., de Oliveira, A.S., Zhang, Y., Sant, G., Miguez, G., Letete, T., Marquard, A., Raubenheimer, S., 2011. Equitable Access to Sustainable Development: Contribution to the Body of Scientific Knowledge. A paper by experts from BASIC countries. BASIC expert group: Beijing, Brasilia, Cape Town and Mumbai. LINK↩
Buchner, B., Herve-Mignucci, M., Trabacchi, C., Wilkinson, J., Stadelmann, M., Boyd, R., Mazza, F., Falconer, A. and Micale, V., 2013. The Landscape of Climate Finance 2013. Climate Policy Initiative, San Francisco, CA, US. LINK
“Climate finance” includes capital investments costs and grants targeting low-carbon and climate-resilient development with direct or indirect greenhouse gas mitigation or adaptation objectives and outcomes. The data relate to 2011–12.↩
Buchner et al., 2013. The Landscape of Climate Finance 2013.↩
Buchner et al., 2013. The Landscape of Climate Finance 2013.↩
Michaelowa, A., and Hoch, S., 2013. FIT For Renewables? Design options for the Green Climate Fund to support renewable energy feed-in tariffs in developing countries. World Future Council, September 2013. LINK
Deutsche Bank (DB), 2011. GET FiT Plus, De-Risking Clean Energy Models in a Developing Country Context, DB Climate Change Advisors, September 2011. LINK↩
International Centre for Trade and Sustainable Development, 2014. APEC talks “green goods,” trade remedies in background. BIORES, 22 August. LINK↩
Ghosh, A., and Esserman, E., 2014. India-US Cooperation on Renewable Energy and Trade. India-US Track II Dialogue on Climate Change and Energy. LINK↩
Velders, G.J.M., Solomon, S. and Daniel, J.S., 2014. Growth of climate change commitments from HFC banks and emissions. Atmospheric Chemistry and Physics, 14(9). 4563–4572. DOI:10.5194/acp-14-4563-2014.
Velders et al. note: “If, for example, HFC production were to be phased out in 2020 instead of 2050, not only could about 91–146 GtCO2-eq of cumulative emission be avoided from 2020 to 2050, but an additional bank of about 39–64 GtCO2-eq could also be avoided in 2050.” The totals range from 130 to 210 GtCO2e by 2050.